.svg)

Sep-2026
Sales
Trend
6-Month
Product Count
SKUs
Avg Price
YoY Sales Change
YoY Price Change


Where to Buy
WZRD is stocked at 17 licensed dispensaries across Arizona, with the deepest coverage in Phoenix, Glendale, Chandler, Bullhead City, and Fountain Hills. Search by ZIP code or city below to find the closest one, or filter by product type if you are after a specific format.
Market Insights Snapshot
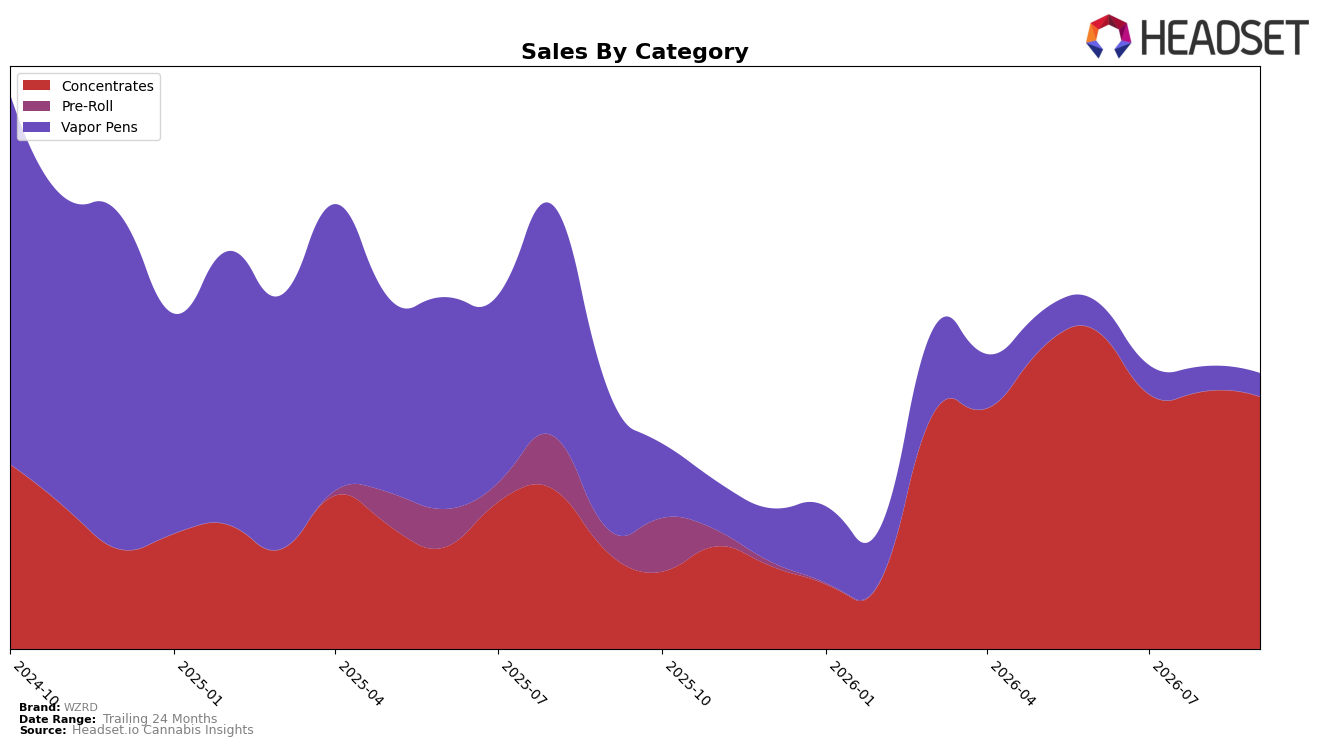
In September 2026, WZRD concentrated 91.55% of sales in Concentrates while Vapor Pens fell to 8.45% share, a mix shift reinforced by a 163.12% year-over-year gain in Concentrates alongside an 83.27% year-over-year decline in Vapor Pens. Month over month, Concentrates slipped 2.09% and Vapor Pens declined 5.97%, indicating that short-term momentum cooled even as the annual tilt accelerated. With category pricing diverging — an average price of $10.70 in Concentrates versus higher pricing in Vapor Pens — and a brand-wide average price down 37.00% year over year, the data implies WZRD is leaning into lower-priced Concentrates to drive unit velocity while de-emphasizing higher-priced Vapor Pens.
WZRD’s position at rank 7 in Concentrates in Arizona, combined with a 163.12% year-over-year surge in that category and a 2.09% month-over-month dip, implies a strategy centered on defending a mid-tier rank through volume rather than premium mix. The simultaneous 83.27% year-over-year contraction and 5.97% month-over-month slide in Vapor Pens, coupled with the 37.00% brand-wide price decline, suggests the brand is trading down to sustain share within Concentrates while ceding presence in Vapor Pens, positioning WZRD as a category specialist where price elasticity favors gains in Concentrates and penalizes diversification into Vapor Pens.
Competitive Landscape
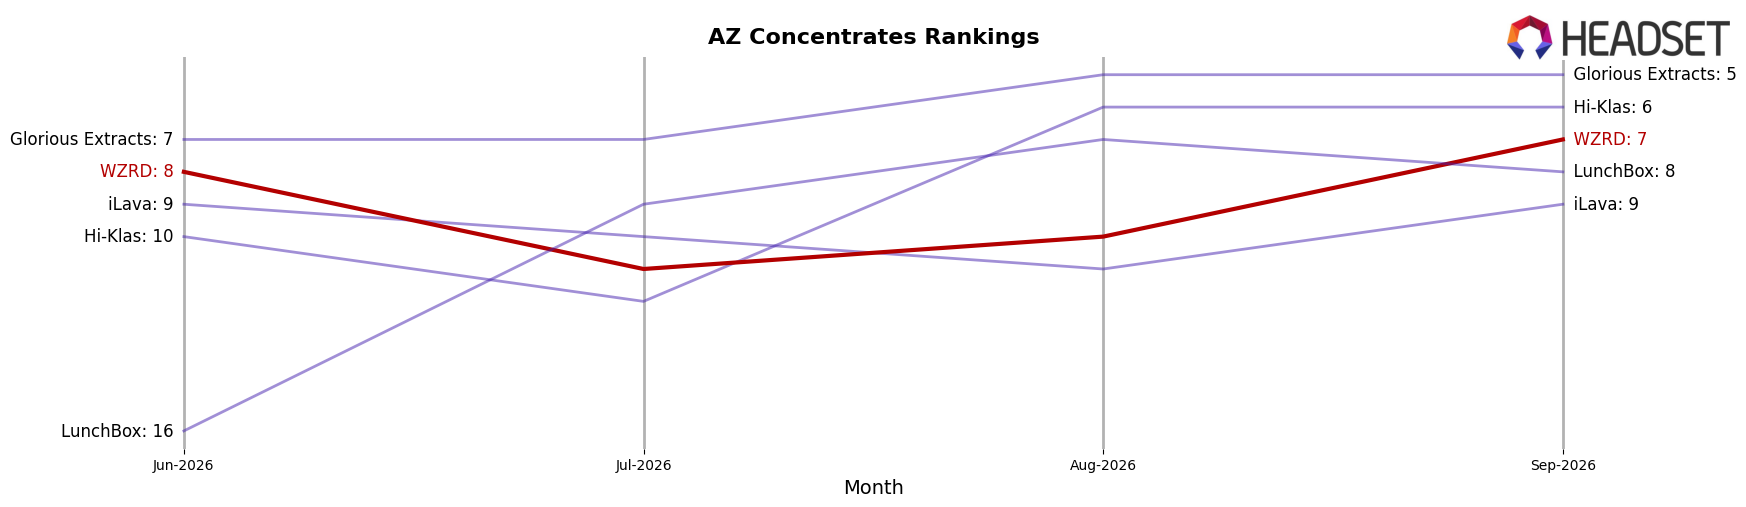
WZRD is ranked #7 in AZ Concentrates in September 2026, improving 15 positions year over year from #22, and inching up 1 spot versus June 2026 when it sat at #8; this coincides with a peak rank of #7 in September 2026 and a top-5 gap where Mohave Cannabis Co. held #1 both year over year and currently while Grow Sciences advanced from #7 to #3 with an estimated 69.4% YoY sales gain. Against a mixed field where Drip Oils + Extracts held at #4 despite a 33.1% YoY sales decline and Glorious Extracts surged to #5 from #29 alongside a 495.5% YoY sales increase, WZRD’s elevation from #22 to #7—paired with a 3-month rise from #8 to #7—implies it is consolidating a stable upper-tier position but must outpace faster climbers to breach the top 5.
Notable Products
Lemon Cherry Badder (1g) posted the steepest decline in September 2026 at -26.3% MoM while dropping to rank 3, and Hashburger Badder (1g) fell -28.3% MoM at rank 5, indicating a pullback in badder demand even as Laughing Gas Budder (1g) held rank 1. Banana Cream Cake x Jealousy Budder (1g) rose 37.8% MoM into rank 4 while Tropical Cherry Shatter (1g) gained 13.3% at rank 6, but Florida Jack Shatter (1g) slid -36.9% at rank 9, pointing to polarized performance within similar textures. With eight of the top ten in September 2026 concentrated in Concentrates and two formats showing opposite trajectories (badder down double-digits while select budder and shatter SKUs rise), the mix implies WZRD is tilting toward higher-traction budder and a narrower set of shatter strains rather than broad badder coverage.
Top Selling Cannabis Brands






Data for this report comes from real-time sales reporting by participating cannabis retailers via their point-of-sale systems, which are linked up with Headset’s business intelligence software. Headset’s data is very reliable, as it comes digitally direct from our partner retailers. However, the potential does exist for misreporting in the instance of duplicates, incorrectly classified products, inaccurate entry of products into point-of-sale systems, or even simple human error at the point of purchase. Thus, there is a slight margin of error to consider. Brands listed on this page are ranked in the top twenty within the market and product category by total retail sales volume.

