.svg)


Where to Buy
YEM is stocked at 19 licensed dispensaries across New York, with the deepest coverage in New York, Brooklyn, Albany, Buffalo, and Fishkill. Search by ZIP code or city below to find the closest one, or filter by product type if you are after a specific format.
Market Insights Snapshot
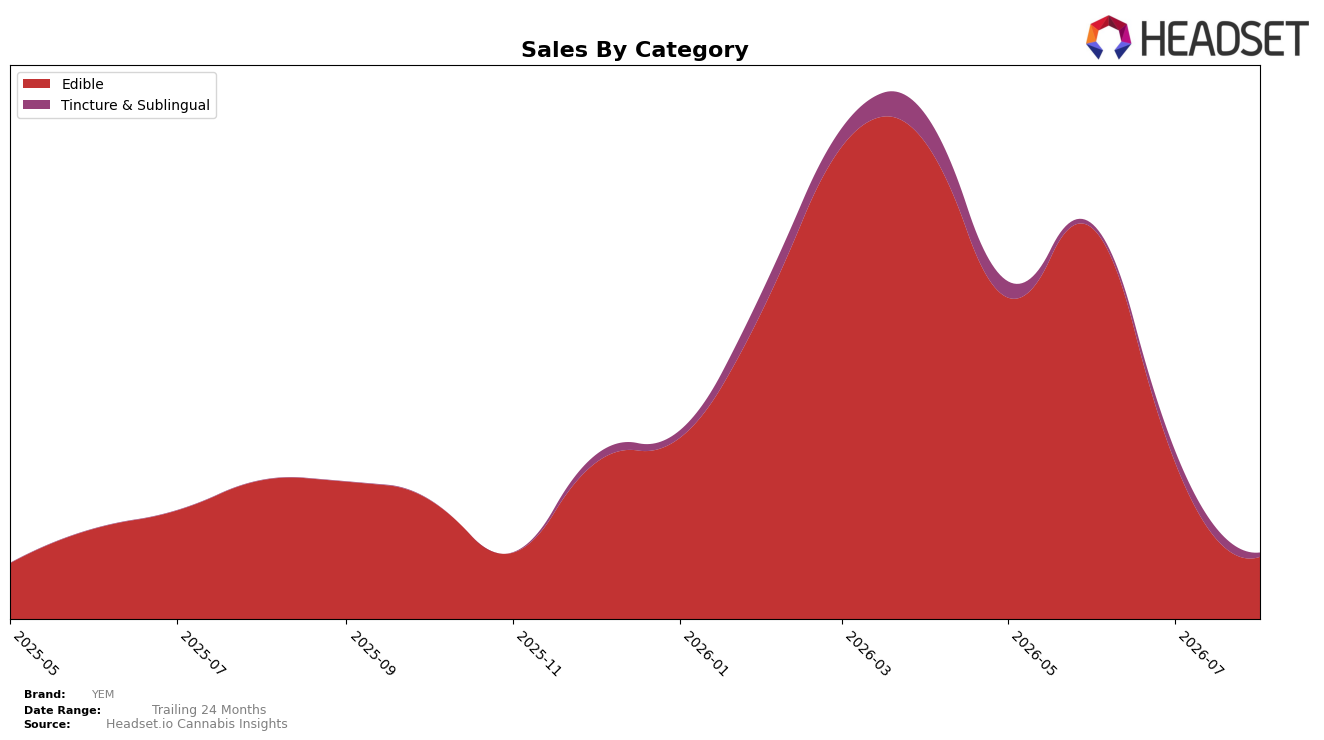
In August 2026, YEM’s mix concentrated in Edible at 93.99% share, with Tincture & Sublingual at 6.00%, indicating a sharper tilt than earlier months as Edible fell 60.38% MoM and 55.36% YoY while Tincture & Sublingual contracted 65.19% MoM and lacks a YoY baseline. The brand’s overall sales declined 52.51% YoY alongside a 20.61% YoY rise in average price to $24.20, and within Edible the average price sat at $23.30, suggesting downsizing in unit volumes even as price realized moved up. Given the rank context centers on Edible in New York with no listed rank, the combination of a 60.38% MoM pullback in the flagship category and only 6.00% share outside it implies concentration risk where short-term volatility in one line drives the whole P&L.
The pattern points to positioning as a price-elevated edible specialist: Edible retains 93.99% share despite a 55.36% YoY sales drop, and the portfolio’s second category at 6.00% share contracted 65.19% MoM, narrowing diversification just as the brand raised average price 20.61% YoY. With New York as the context market and Tincture & Sublingual carrying a $61.64 average price versus $23.30 in Edible, the 60.38% MoM decline in Edible means mix cannot offset volume erosion through higher-priced formats at current scale. This implies YEM’s current positioning relies on maintaining edible unit throughput while managing price elasticity, because the portfolio’s limited 6.00% hedge leaves overall performance highly sensitive to Edible rank and velocity swings.
Competitive Landscape
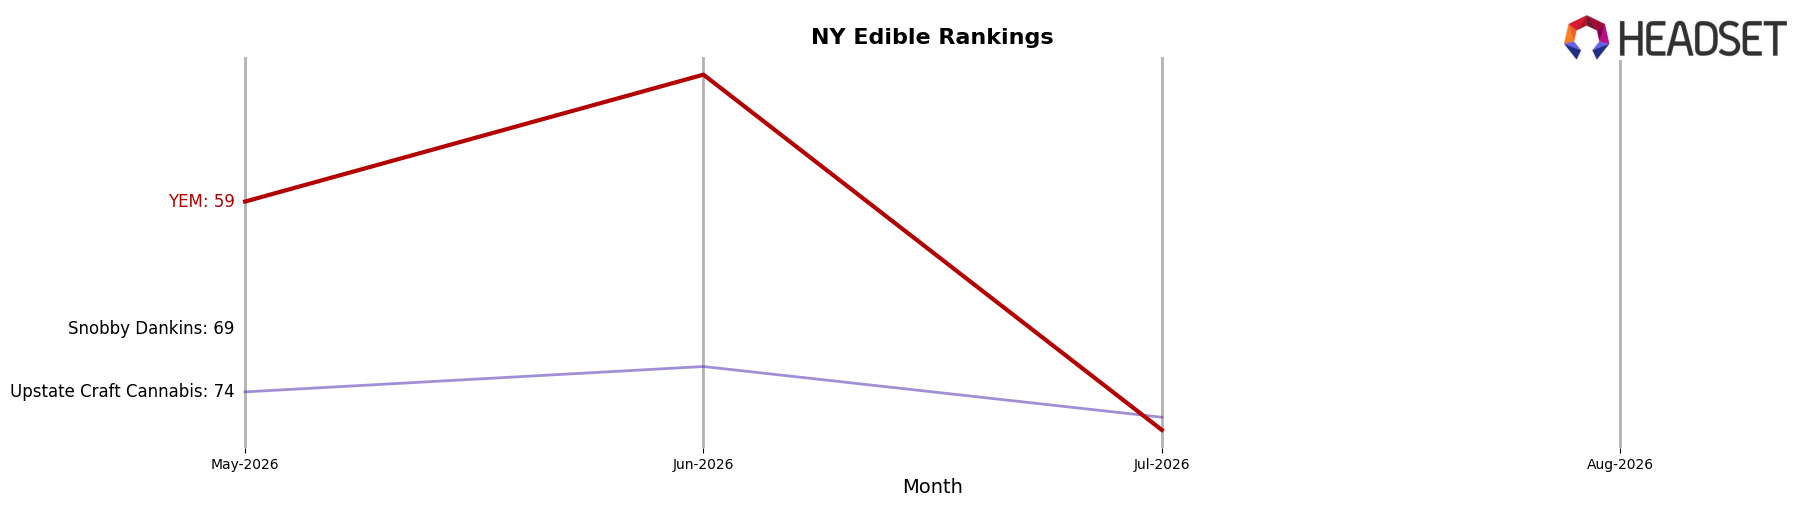
YEM is ranked #95 in NY Edible in August 2026, down 23 positions year over year from #72 and 36 positions below its three-month rank of #59; the brand also sits 46 places below its June 2026 peak of #49, indicating a multi-month slide. In contrast, Camino moved up from #2 to #1 with a 10.5% year-over-year sales increase while Off Hours fell from #1 to #2 alongside a 24.8% year-over-year sales decline, and Gron / Grön advanced from #4 to #3 with 14.8% year-over-year growth; relative to these shifts, YEM’s drop from #72 to #95 signals that recent share losses are more structural than seasonal and imply continued pressure on distribution or velocity unless the trajectory reverses.
Notable Products
Black Cherry Sugar Free Rosin Gummies 10-Pack (100mg) posted the steepest August 2026 decline at -87.8% MoM while holding rank 7, and Watermelon x Tropicana Cherry Gummies 10-Pack (100mg) fell -95.6% MoM at rank 9, indicating sharp contraction at the long tail rather than a simple rank reshuffle. At the top, Strawberry Lemonade Sugar Free Rosin Gummies 10-Pack (100mg) stayed at rank 1 despite a -51.3% MoM drop, and Sleep - CBN/THC 1:1 Elderberry Live Rosin Gummies 10-Pack (100mg CBN, 100mg THC) slid to rank 2 with -56.8% MoM, pointing to broad pullback even among lead SKUs. Eight of the top ten are Edible SKUs, yet the only MoM gainer was Hybrid Watermelon Rosin Gummies 10-Pack (100mg) at +6.8% and rank 5, suggesting flavor-specific stickiness amid category softness; the lone Tincture & Sublingual entry, Hybrid Full Spectrum Solventless Rosin Drops (1000mg), also declined -65.1% at rank 8, reinforcing the demand dip across form factors. The pattern implies YEM’s commercial direction hinges on stabilizing core sugar-free and rosin gummy variants while pruning weak flavors, rather than expanding into adjacent formats, with August volume concentrated but volatile at the top and limited cushioning elsewhere.
Top Selling Cannabis Brands






Data for this report comes from real-time sales reporting by participating cannabis retailers via their point-of-sale systems, which are linked up with Headset’s business intelligence software. Headset’s data is very reliable, as it comes digitally direct from our partner retailers. However, the potential does exist for misreporting in the instance of duplicates, incorrectly classified products, inaccurate entry of products into point-of-sale systems, or even simple human error at the point of purchase. Thus, there is a slight margin of error to consider. Brands listed on this page are ranked in the top twenty within the market and product category by total retail sales volume.

