.svg)


Market Insights Snapshot
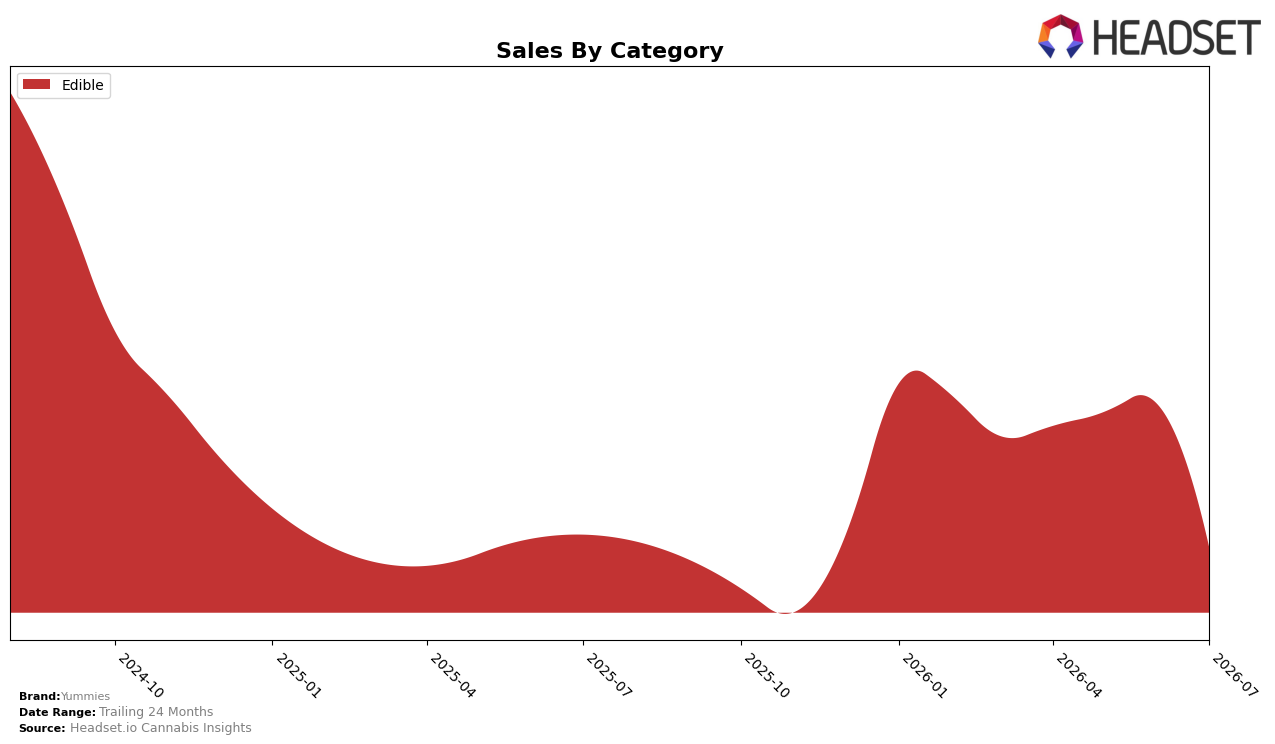
In July 2026, Yummies operated as a single-category brand with Edible accounting for 100.0% category share and a month-over-month sales change of -64.17%. The brand’s 24-month sales change of -63.68% aligns closely with the July 2026 Edible MoM decline of -64.17%, indicating that the short-term contraction is not a one-off swing but consistent with a longer retrenchment. With average price at $13.18 and no category diversification offsetting volatility, the pattern implies concentration risk: a fully Edible-dependent mix is amplifying month-level shocks rather than smoothing them through multi-category exposure.
The consolidation into Edible at 100.0% share in July 2026, paired with a -64.17% MoM movement and a -63.68% 24-month trend, places Yummies as a volatility taker rather than a volatility manager. In Nevada Edibles, the absence of rank data removes signal on competitive standing while the tight coupling of short-term and multi-year declines suggests brand positioning that is tethered to a single pricing and demand corridor. The implication is a need to rebalance mix or recalibrate pricing within Edibles, because concentration at 100.0% with a -64.17% MoM swing and a -63.68% 24-month pattern points to demand cyclicality outpacing Yummies’s ability to buffer with assortment.
Competitive Landscape
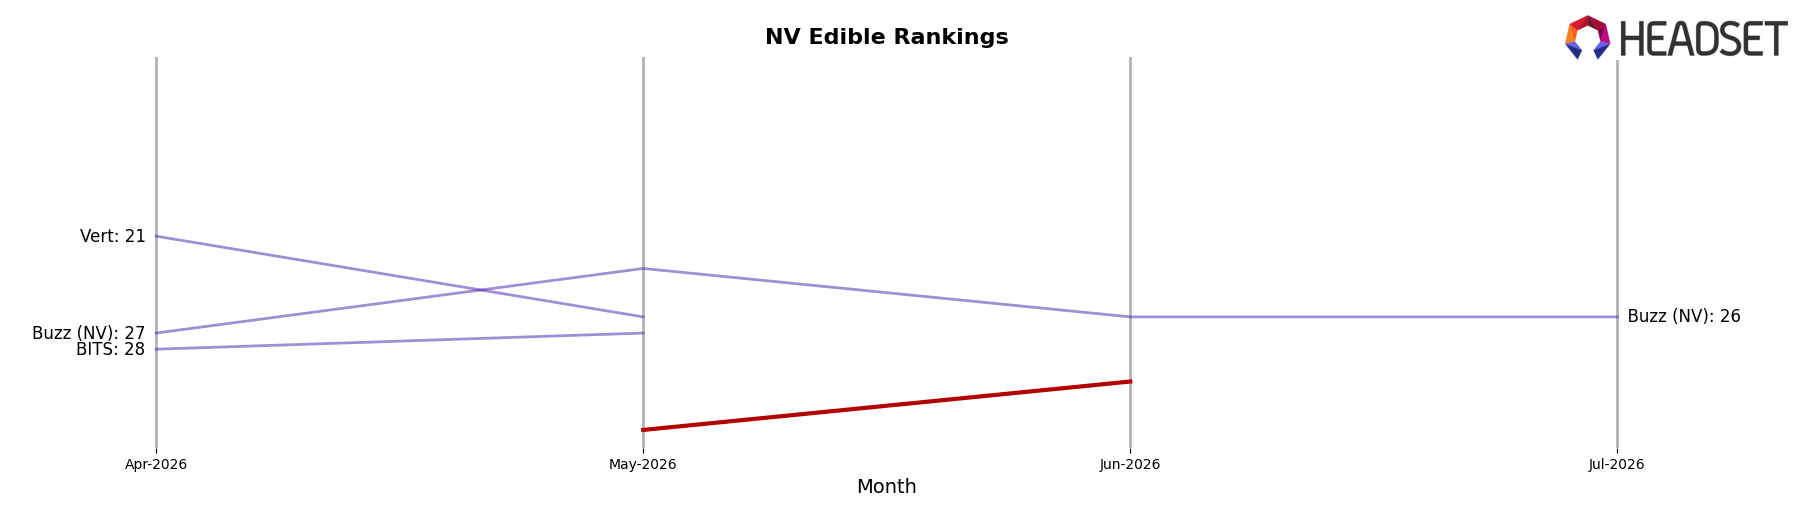
Yummies sits at rank #33 in NV Edible in July 2026, with no year-over-year rank comparison available, and it inched up 1 position from #34 in April 2026 while coming off a peak of #30 in June 2026; meanwhile, Wyld held #1 with a modest +2.7% YoY sales change as Kanha / Sunderstorm advanced from #10 to #4 on +196.7% YoY sales, indicating the upper tier is consolidating and raising the bar for mid-pack mobility. Compared with Incredibles steady at #2 despite a -4.0% YoY sales dip and HaHa sliding from #3 to #5 on -28.5% YoY sales, Yummies’ drop from #30 in June 2026 to #33 in July 2026 alongside a 1-position improvement since April 2026 points to short-cycle volatility amid long-cycle stagnation; the thesis is that without outpacing competitors experiencing double- and triple-digit YoY shifts, a mid-30s rank will persist and upward breakthroughs will be rare.
Notable Products
Dark Chocolate Bar 10-Pack (100mg) led the movement with a -70.0% month-over-month drop and still held rank 3, while Milk Chocolate Bar 10-Pack (100mg) fell -60.6% yet remained rank 1. Peanut Butter & Milk Chocolate Bar 10-Pack (100mg) declined -64.3% at rank 2, and all three top-3 positions were occupied by Edible SKUs in July 2026. With Edibles concentrating the entire top three despite declines exceeding -60%, the pattern implies Yummies is over-weighted in a single category that is contracting, signaling a need to rebalance assortment or reposition pricing to stabilize volume.
Top Selling Cannabis Brands






Data for this report comes from real-time sales reporting by participating cannabis retailers via their point-of-sale systems, which are linked up with Headset’s business intelligence software. Headset’s data is very reliable, as it comes digitally direct from our partner retailers. However, the potential does exist for misreporting in the instance of duplicates, incorrectly classified products, inaccurate entry of products into point-of-sale systems, or even simple human error at the point of purchase. Thus, there is a slight margin of error to consider. Brands listed on this page are ranked in the top twenty within the market and product category by total retail sales volume.

