New York Cannabis Sales

Sep, 2026
Jump to:
Overview
Comparison
Categories
Historical Data
News / Reports
Cannabis Market Data

Overview

New York’s cannabis market has demonstrated robust growth over the past year, with September 2026 sales reaching $160.8 million. This marks a 10% year-over-year increase and a 21.6% rise in units sold, signaling both expanding consumer demand and greater product accessibility. While the market experienced some volatility in monthly sales—such as a notable spike in December 2025 and a dip in early 2026—the overall trend remains upward, with consistent recovery and growth through the summer and into the fall.

Pricing in New York remains among the highest in the country, with an average item price of $28.62 in September 2026. However, prices have gradually declined from $31.63 a year prior, reflecting increased competition and a broader product mix. This price softening, paired with rising unit sales, suggests that consumers are responding positively to greater choice and value.

$160.75M

Sep, 2026

Sales

10 %

Year Over Year

Growth

Data Snapshot Oct 03, 2026

Market Comparison

New York ranks as one of the largest cannabis markets in the US, with September 2026 sales of $160.8 million. This places New York ahead of states like Arizona ($95.2M), Nevada ($49.8M), and Oregon ($74.8M), but behind California ($329.5M) and Michigan ($242.2M). New York’s 10% year-over-year sales growth is above the national average, with only Ohio (33.2%) and Missouri (7.6%) posting higher rates among major markets.

Average item prices in New York ($28.62) are among the highest nationally, rivaled only by New Jersey ($29.10) and Connecticut ($27.58). In contrast, mature markets like Michigan ($8.31) and Oregon ($11.12) have much lower average prices, reflecting greater price competition and market maturity.

New York Weed Prices

Product
Sep, 2026
YoY
Flower (Gram)
$12.93
Flower (Eighth)
$33.63
Edible (100mg)
$21.92
Concentrate (Gram)
$44.74
Top Strain
Blue Dream
| State | Sales ($M) | Avg. Price ($) | YoY Sales Growth | |------------|------------|----------------|------------------| | [California](https://www.headset.io/markets/california) | 329.5 | 17.72 | 0.6% | | [Michigan](https://www.headset.io/markets/michigan) | 242.2 | 8.31 | -3.6% | | [New York](https://www.headset.io/markets/new-york) | 160.8 | 28.62 | 10.0% | | [Massachusetts](https://www.headset.io/markets/massachusetts) | 142.3 | 16.51 | 4.9% | | [Illinois](https://www.headset.io/markets/illinois) | 131.2 | 27.22 | 10.8% | | [Missouri](https://www.headset.io/markets/missouri) | 128.5 | 26.44 | 7.6% | | [Ohio](https://www.headset.io/markets/ohio) | 116.8 | 29.90 | 33.2% | | [Arizona](https://www.headset.io/markets/arizona) | 95.2 | 17.05 | 5.2% |
Data Snapshot Oct 03, 2026

Category Performance

Category
Sep, 2026
YoY
$
53.22
M
5.3
%
$
41.43
M
13.1
%
$
37.53
M
18.3
%
$
19.35
M
1.9
%
$
4.66
M
28.0
%
$
2.51
M
16.2
%
$
0.47
M
-29.9
%
$
0.3
M
0.0
%

While Flower and Pre-Roll categories dominate in total sales, the Beverage category stands out for its unique growth trajectory. Beverages posted $2.5 million in sales for September 2026, up 16.1% year-over-year—outpacing the overall market’s growth rate. Unit sales surged 32.6%, indicating strong consumer interest in this emerging format, even as average prices held steady at around $5.12.

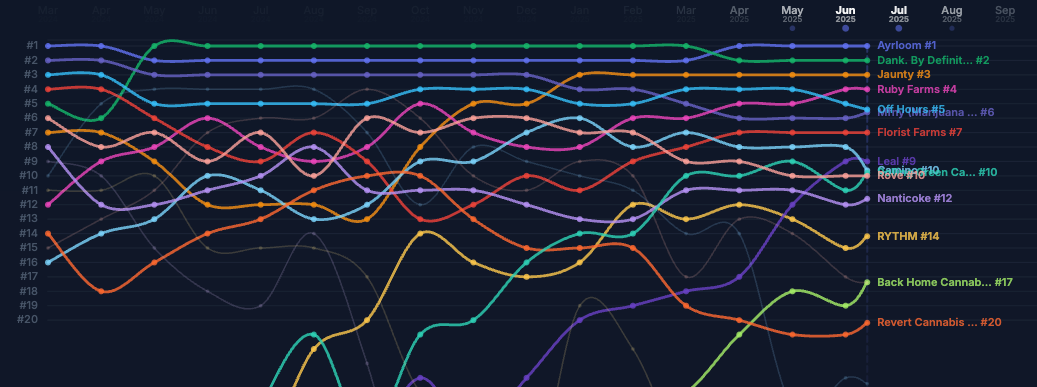
Within Beverages, Carbonated and Iced Tea, Lemonade, and Fruit segments lead in both sales and units, each generating over $700,000 in monthly sales. Notably, the Sports and Energy segment saw explosive growth, with sales up over 300% year-over-year, albeit from a smaller base. The top brands in the Beverage category are driving this momentum, with Ayrloom commanding over half the category’s sales, followed by Layup and Harney Brothers Cannabis.
| Segment | Sales ($M) | Units Sold | YoY Sales Growth | |---------------------------------|------------|------------|------------------| | Carbonated | 0.72 | 154,967 | 18.3% | | Iced Tea, Lemonade, and Fruit | 0.73 | 153,953 | 21.5% | | Mocktails | 0.24 | 45,522 | 18.4% | | Water | 0.48 | 99,380 | -6.3% | | Sports and Energy | 0.12 | 8,722 | 309.3% | | Tea, Coffee and Hot Cocoa | 0.14 | 24,818 | 112.5% | | Drops, Mixes, Elixirs, Syrups | 0.09 | 3,402 | -41.3% | | Milk | 0.0006 | 41 | n/a | | Brand Name | Sales ($M) | Units Sold | Avg. Price ($) | |-----------------------------|------------|------------|----------------| | [Ayrloom](https://www.headset.io/brands/ayrloom) | 1.34 | 283,555 | 4.72 | | [Layup](https://www.headset.io/brands/layup) | 0.33 | 72,061 | 4.64 | | [Harney Brothers Cannabis](https://www.headset.io/brands/harney-brothers-cannabis) | 0.19 | 33,206 | 5.87 | | [High Peaks](https://www.headset.io/brands/high-peaks) | 0.15 | 27,360 | 5.51 | | [Tune](https://www.headset.io/brands/tune) | 0.11 | 20,833 | 5.48 | | [Weed Water](https://www.headset.io/brands/weed-water) | 0.08 | 18,692 | 4.54 | | [Cycling Frog](https://www.headset.io/brands/cycling-frog) | 0.08 | 17,947 | 4.40 | | [CQ (Cannabis Quencher)](https://www.headset.io/brands/cq-cannabis-quencher) | 0.05 | 3,155 | 17.03 |
Data Snapshot Oct 03, 2026

Top Cannabis Brands in New York

Market Trends

Product Category Market Share In New York

Monthly Cannabis Sales

Historical Cannabis Sales In New York

New York Cannabis Reports

Report
December 21, 2023

New York Marijuana Trends

As of November 2023, New York adult use has cleared the legal hurdles and is now in the early stages of what is set to be one of the largest adult-use markets in the US.

New York Cannabis News

Blog
March 4, 2026

Two Years In: Winners, Losers, and the Brands Reshaping New York Cannabis

An analysis of 24 months of brand sales rankings in New York's legal cannabis market reveals a story of rapid growth, surprising upstarts, and some painful declines.
Blog
February 20, 2026

mFused × Headset Bridge – Turning Inventory Chaos into a 20% Sales Lift

How mFused used Headset Bridge to build a vendor-managed inventory program across 300+ stores, achieving a 20% average sales lift, zero partner churn in five years, and $90M+ in annually managed retail revenue.
User rating
NY
Emerging

Get More New York Cannabis Market Data

Sign-up to track retail sales, product market share, and see today’s best selling cannabis products.
Header image