.svg)
Sep-2026
Sales
Trend
6-Month
Product Count
SKUs
Avg Price
YoY Sales Change
YoY Price Change


Where to Buy
Bison is stocked at 20 licensed dispensaries across Missouri, Oklahoma, and New York, 15 of them in Missouri, with the deepest coverage in Lees Summit, St. Louis, Berkeley, Farmington, and Hollister. Search by ZIP code or city below to find the closest one, or filter by product type if you are after a specific format.
Market Insights Snapshot
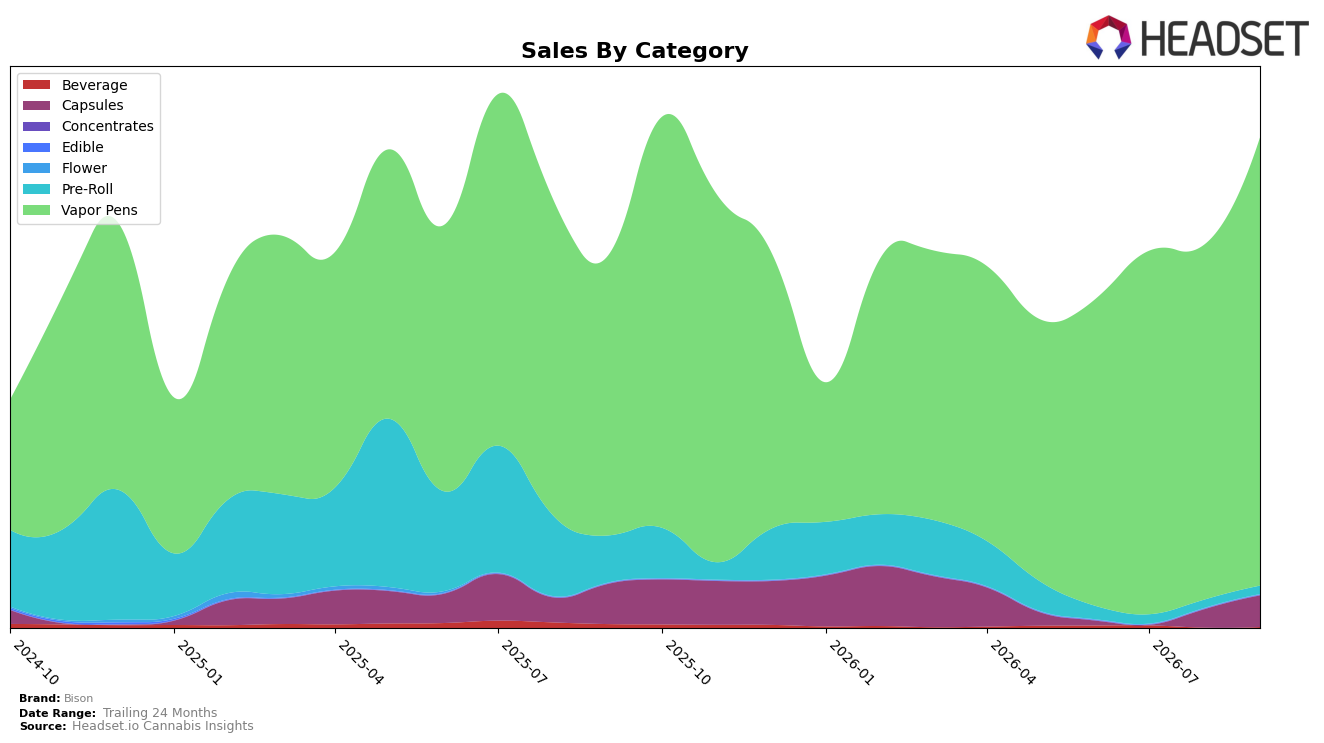
Bison concentrated 91.81% of September 2026 sales in Vapor Pens, where category sales rose 60.08% year over year and 26.22% month over month, while average price in the portfolio climbed 32.59% YoY to $56.74. Capsules held 6.39% share with a -21.69% YoY decline but a 72.39% MoM rebound, and Pre-Roll at 1.65% share fell -82.78% YoY with a 2.42% MoM uptick; Beverage was 0.16% share with -78.80% YoY but 356.30% MoM growth. This mix implies Bison is leaning into higher-priced, faster-growing Vapor Pens for September 2026 while using Capsules and Beverage as tactical recovery pockets despite deep YoY contractions, indicating a portfolio skew that prioritizes momentum categories over breadth.
Given a rank of 31 in Vapor Pens within Missouri and a 26.22% MoM lift alongside 60.08% YoY growth in that core category, Bison’s positioning hinges on deepening penetration where it already competes rather than diversifying into lagging formats. The sharp 72.39% MoM rise in Capsules against a -21.69% YoY baseline, plus a 356.30% MoM spike in Beverage off a 0.16% share, suggests test-and-expand behavior for adjacencies while protecting the 91.81% Vapor Pen anchor; this points to a strategy to convert price-led gains into share by reinforcing the flagship segment first and using smaller categories for incremental reach rather than volume displacement.
Competitive Landscape
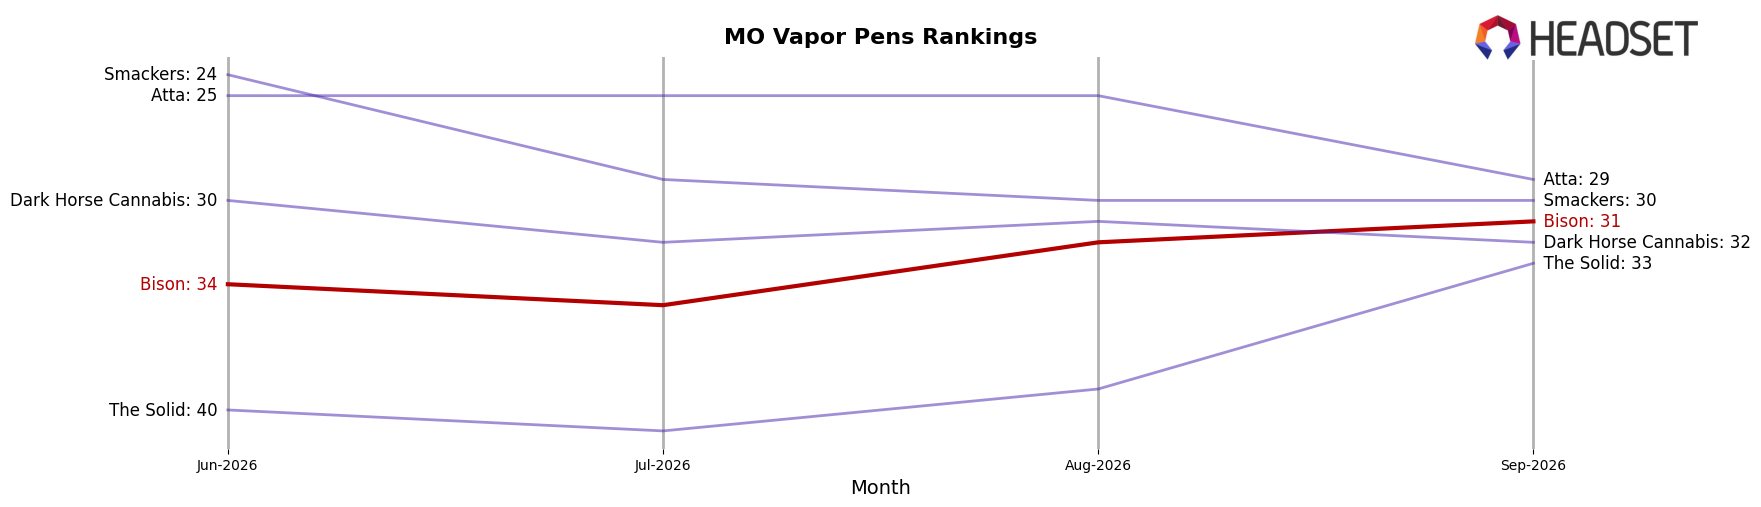
Bison sits at rank #31 in Missouri Vapor Pens in September 2026, improving 1 position year over year from #32 while also climbing 3 spots since June 2026 from #34; however, it remains 3 places below its October 2025 peak at #28 and trails the top tier where Illicit / Illicit Gardens held #1 both this year and last and Rove slid from #3 year over year to #5 with a -4.34% sales change. Against this backdrop, Good Day Farm advanced from #5 to #3 alongside a 35.36% sales increase while Galactic stayed at #2 with 20.41% growth, indicating Bison’s incremental rank gains are occurring while leaders either hold or widen gaps; the pattern implies Bison’s path back toward its #28 peak likely requires outpacing mid-pack shifts rather than waiting on top-tier erosion.
Notable Products
Inspired Pre-Roll (1g) posted the standout movement in September 2026 with a 116% month-over-month surge and climbed into rank 7, while Sleepy Pre-Roll (1g) fell 22% MoM to rank 6. Vapor Pens concentrated the leaderboard with ranks 1 through 4, as Pineapple Express Distillate Disposable (2g) rose 28% MoM at rank 1 and Jack Herer Distillate Disposable (2g) advanced 46% MoM at rank 4. The Capsules line mixed momentum, with EOCO High Dose Capsules 7-Pack (430mg) up 24% MoM at rank 5 and EOCO Time Release Medium Dose Capsules 7-Pack (250mg) debuting at rank 8 off a low base near $7.3K in sales. The pattern implies a tilt toward inhalable demand anchored by Vapor Pens and selective reactivation in Pre-Rolls, suggesting Bison is consolidating around fast-turn SKUs while testing breadth in Capsules.
Top Selling Cannabis Brands






Data for this report comes from real-time sales reporting by participating cannabis retailers via their point-of-sale systems, which are linked up with Headset’s business intelligence software. Headset’s data is very reliable, as it comes digitally direct from our partner retailers. However, the potential does exist for misreporting in the instance of duplicates, incorrectly classified products, inaccurate entry of products into point-of-sale systems, or even simple human error at the point of purchase. Thus, there is a slight margin of error to consider. Brands listed on this page are ranked in the top twenty within the market and product category by total retail sales volume.

