.svg)

Sep-2026
Sales
Trend
6-Month
Product Count
SKUs
Avg Price
YoY Sales Change
YoY Price Change


Where to Buy
Heartland Labs is stocked at 132 licensed dispensaries across Missouri and Oklahoma, 131 of them in Missouri, with the deepest coverage in St. Louis, Kansas City, Columbia, Springfield, and Cape Girardeau. Search by ZIP code or city below to find the closest one, or filter by product type if you are after a specific format.
Market Insights Snapshot
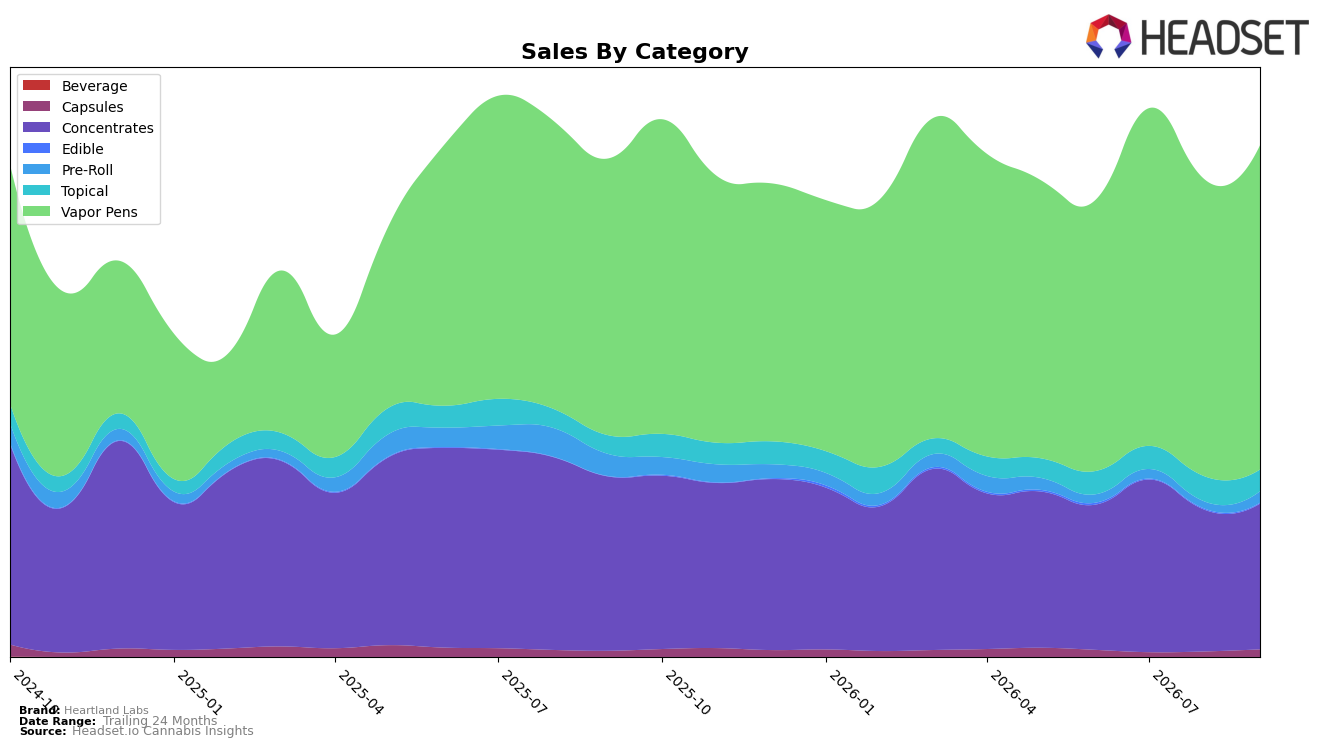
In September 2026, Heartland Labs leaned further into Vapor Pens, which held 63.55% share and grew 17.16% year over year and 9.21% month over month, while Concentrates at 28.52% share contracted 16.44% YoY but ticked up 2.85% MoM. Smaller lines were volatile: Topical at 4.20% share advanced 16.37% YoY but fell 13.96% MoM, Pre-Roll at 2.18% share plunged 48.90% YoY yet spiked 63.20% MoM, and Capsules at 1.43% share rose 24.41% YoY and 40.51% MoM. Edible remained tiny at 0.12% share with a 512.21% YoY jump but a 23.71% MoM pullback. With Vapor Pens ranked 24th in Missouri and the brand-level sales up 2.65% YoY alongside a 0.78% YoY average price increase to $32.19, the pattern implies the mix is pivoting toward higher-velocity inhalables while trimming exposure to lagging form factors.
The divergence between a growing Vapor Pens core (+17.16% YoY) and a shrinking Concentrates base (−16.44% YoY) suggests Heartland Labs’ positioning is skewing toward convenience-led use cases, reinforced by outsized MoM momentum in Pre-Roll (+63.20%) and Capsules (+40.51%). Given the Vapor Pens rank of 24 in Missouri and a 9.21% MoM gain within that category, the brand is likely consolidating as a mid-pack inhalables player rather than a category generalist, while the 13.96% MoM decline in Topical and 23.71% MoM decline in Edible indicate limited traction in non-inhalable wellness and confection formats. This configuration implies near-term share defense will hinge on sustaining double-digit growth in Vapor Pens and converting Pre-Roll’s MoM surge into repeatable volume, with Concentrates acting as a drag unless its 2.85% MoM uptick becomes a multi-month recovery.
Competitive Landscape
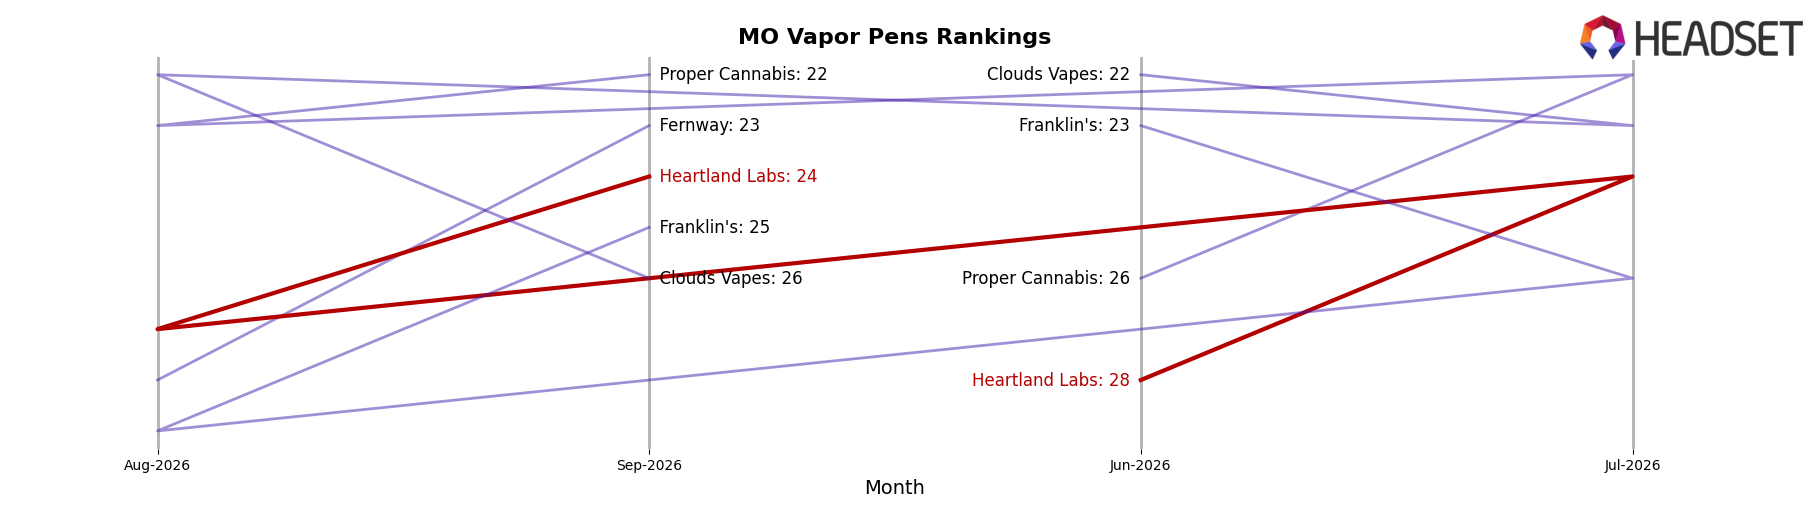
Heartland Labs sits at rank #24 in MO Vapor Pens in September 2026, a 1-spot improvement from #25 year over year, and up 4 positions from #28 in June 2026, marking its peak rank of #24 in September 2026; by contrast, Illicit / Illicit Gardens held #1 both year over year and currently with a 17.1% YoY sales increase, while Rove slid from #3 YoY to #5 currently alongside a -4.3% YoY sales change, indicating Heartland Labs is inching upward as some top-tier competitors reshuffle. This pattern implies Heartland Labs’ gradual rank gains are tied to stability rather than breakout share capture, suggesting the path to further ascent relies on capitalizing when leaders hold steady and mid-pack brands cede positions.
Notable Products
Blackberry Pie Distillate Cartridge (1g) delivered the standout move in September 2026 with an 80.5% month-over-month surge and a climb to rank 2, while Sativa FECO RSO Syringe (1g) fell 10.0% and Hybrid FECO RSO Syringe (1g) declined 13.6%, signaling a decisive tilt toward inhalables. Indica FECO RSO Syringe (1g) still held rank 1 with a 28.9% gain, but four of the top ten are Vapor Pens concentrated between ranks 2 and 9, outpacing the FECO line’s mixed momentum. Heartland Labs x Elder Farms - CBD/THC 1:1 Herbal ReLeaf Salve (150mg CBD, 150mg THC, 2oz) slid 14.0% at rank 10 even as Blackberry Pie Distillate Cartridge (1g) added $69,206, indicating resources are migrating toward fast-turn vapor SKUs. The pattern implies Heartland Labs is pivoting shelf space and demand capture toward Vapor Pens where velocity and rank progression are outpacing legacy FECO and Topical placements.
Top Selling Cannabis Brands






Data for this report comes from real-time sales reporting by participating cannabis retailers via their point-of-sale systems, which are linked up with Headset’s business intelligence software. Headset’s data is very reliable, as it comes digitally direct from our partner retailers. However, the potential does exist for misreporting in the instance of duplicates, incorrectly classified products, inaccurate entry of products into point-of-sale systems, or even simple human error at the point of purchase. Thus, there is a slight margin of error to consider. Brands listed on this page are ranked in the top twenty within the market and product category by total retail sales volume.

