.svg)

Sep-2026
Sales
Trend
6-Month
Product Count
SKUs
Avg Price
YoY Sales Change
YoY Price Change


Where to Buy
FloraCal Farms is stocked at 300 licensed dispensaries across Illinois, Pennsylvania, and 5 other states, 137 of them in Illinois, with the deepest coverage in Chicago, Normal, Quincy, Champaign, and East Peoria. Search by ZIP code or city below to find the closest one, or filter by product type if you are after a specific format.
Market Insights Snapshot
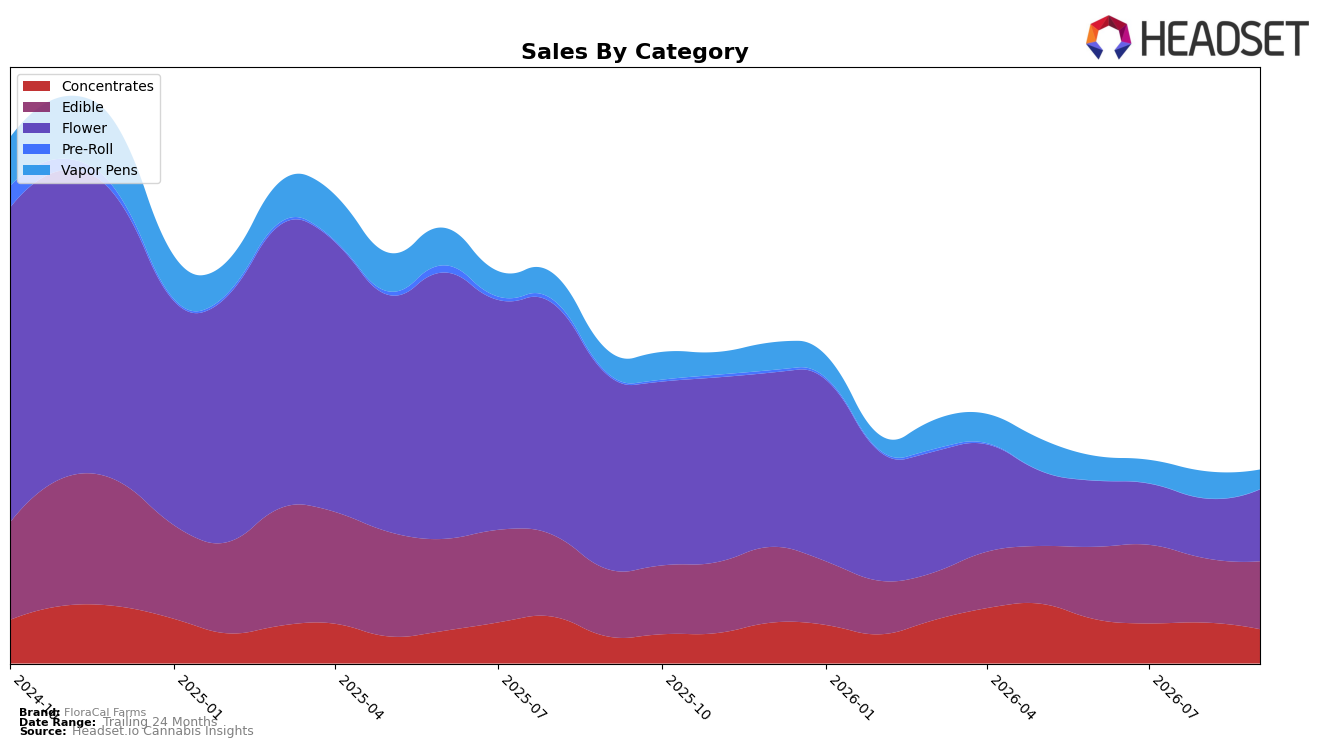
In September 2026, FloraCal Farms concentrated 37.16% of sales in Flower and 35.11% in Edible, while Concentrates and Vapor Pens held 17.69% and 10.04% shares respectively; within Flower, year-over-year was down 63.02% but month-over-month rose 20.52%, whereas Edible grew 1.02% YoY and 5.35% MoM. Concentrates advanced 27.65% YoY but fell 16.27% MoM, and Vapor Pens declined 14.82% YoY and 27.81% MoM; the overall average price slipped 2.62% YoY to $27.22, and in Illinois Flower the brand sat at rank 50. The pattern implies a pivot toward lower-volatility categories with Edible stabilizing share alongside a tactical rebound in Flower, while short-term pullbacks in Concentrates and Vapor Pens temper near-term mix expansion in inhalables.
The mix shifts suggest repositioning headroom: maintaining a 37.16% Flower share with a 20.52% MoM uptick despite a 63.02% YoY decline indicates headroom to defend core shelves, while the 35.11% Edible share with 1.02% YoY growth supports steadier baseline velocity. With Concentrates up 27.65% YoY but down 16.27% MoM and Vapor Pens down 14.82% YoY and 27.81% MoM, the near-term path favors reinforcing Flower-Edible bundles and price-pack architecture, as the $27.22 average price alongside a 2.62% YoY decrease creates room to trade consumers across formats without eroding margin positioning.
Competitive Landscape
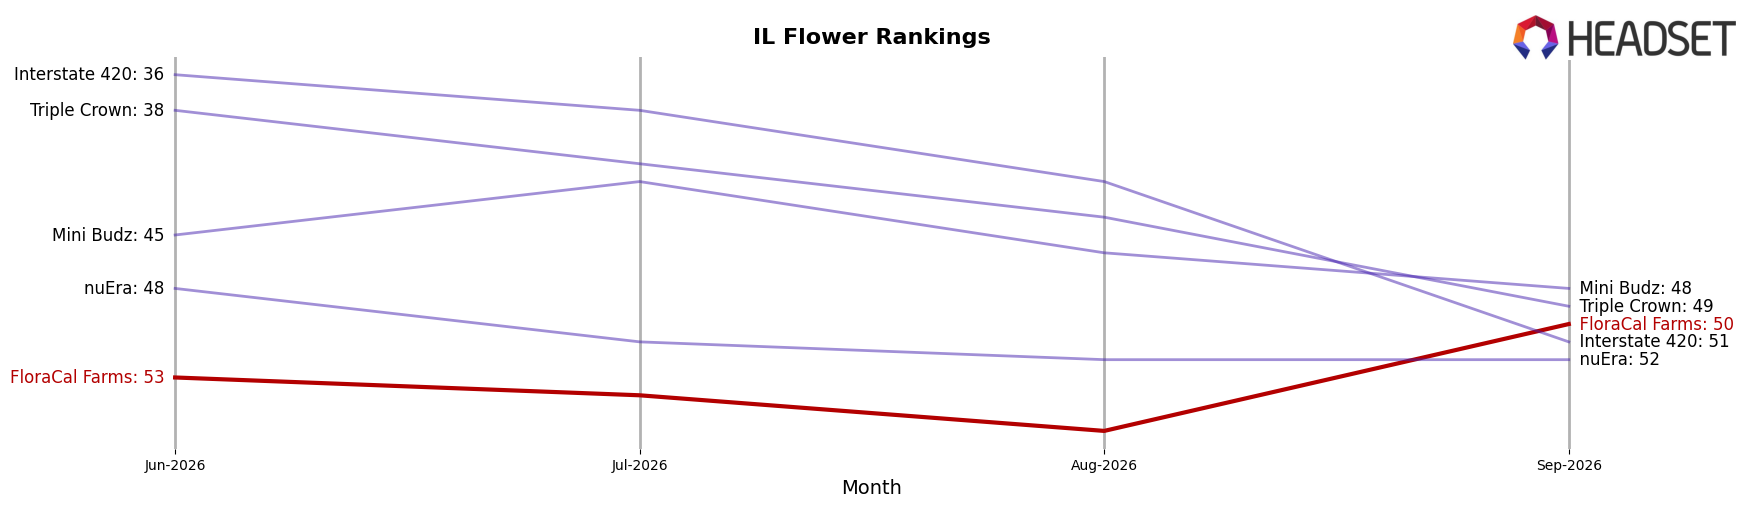
FloraCal Farms sits at rank #50 in Illinois Flower in September 2026, down 13 positions year over year from #37 and up 3 places from #53 over the past three months, while its historical peak was #24 in September 2024. Against this backdrop, High Supply / Supply held #1 with a -2.5% year-over-year sales change, and RYTHM stayed at #2 with +22.0% year-over-year growth, indicating FloraCal Farms has lost relative standing as top-tier competitors either maintained leadership or expanded; the trajectory implies the brand is settling into a mid-to-lower tier unless it reverses the 13-rank year-over-year decline and sustains quarter-on-quarter improvements beyond a 3-rank lift.
Notable Products
Kush Mints (3.5g) posted the standout move in September 2026 with a 139% month-over-month surge, jumping into rank 7, while Blue Sapphire (3.5g) fell 18% to rank 10; this split signals a pivot within Flower toward newer or reactivated SKUs that can scale quickly. Pink Lemonade Live Rosin Gummies 10-Pack (100mg) held rank 1 despite a 7% decline, and Wild Berry Live Rosin Gummies 10-Pack (100mg) dropped 24% at rank 2, with four of the top ten anchored in Edibles indicating category breadth even as momentum concentrates in select Flower items. Morning Dew (3.5g) rose 80% to rank 9, contrasting with Strawberry Jam Live Rosin Gummies 10-Pack (100mg) down 6% at rank 5, and the balance of gains suggests near-term mix shift toward Flower units despite Edibles still generating the single largest SKU revenue at $43,094. The pattern implies FloraCal Farms is leaning into Flower-led velocity to offset softening in legacy Edible leaders, favoring scalable strains over flavor-line extensions.
Top Selling Cannabis Brands






Data for this report comes from real-time sales reporting by participating cannabis retailers via their point-of-sale systems, which are linked up with Headset’s business intelligence software. Headset’s data is very reliable, as it comes digitally direct from our partner retailers. However, the potential does exist for misreporting in the instance of duplicates, incorrectly classified products, inaccurate entry of products into point-of-sale systems, or even simple human error at the point of purchase. Thus, there is a slight margin of error to consider. Brands listed on this page are ranked in the top twenty within the market and product category by total retail sales volume.

