Jun-2026
Sales
Trend
6-Month
Product Count
SKUs
Avg Price
YoY Sales Change
YoY Price Change
Market Insights Snapshot
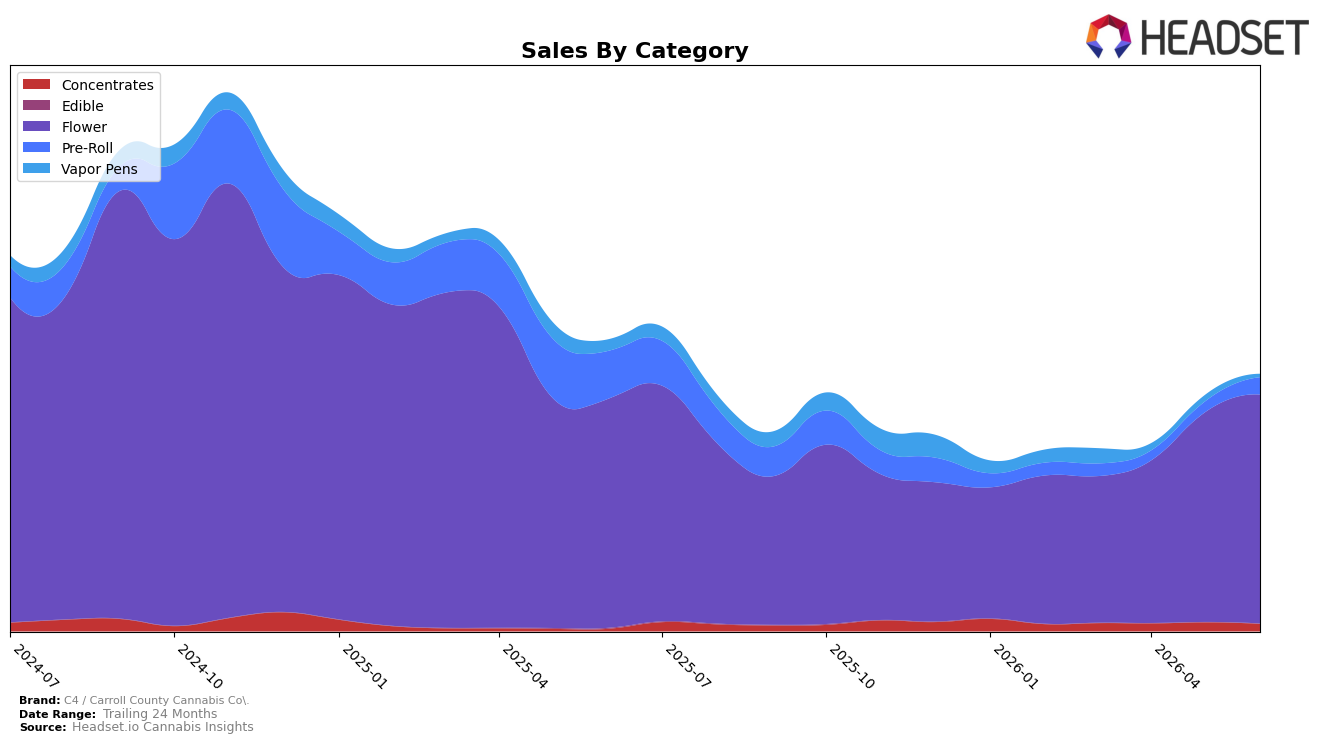
C4 / Carroll County Cannabis Co. concentrated 89.40% of June 2026 sales in Flower, where sales were down 3.36% year over year but up 9.34% month over month, while Pre-Roll held 6.61% share with a 64.42% year-over-year decline offset by a 62.14% month-over-month rebound. Concentrates reached 2.80% share with 214.84% year-over-year growth but fell 17.38% month over month, and Vapor Pens slipped to 1.19% share with a 72.89% year-over-year drop and a 50.59% month-over-month decline; the average price across the brand edged down 1.93% year over year to $24.73. With Flower ranked 28th in Missouri and carrying nearly nine-tenths of mix, the pattern implies the brand’s short-term performance hinges on Flower momentum while volatility in minor categories contributes little to offset an 11.89% brand-level year-over-year decline.
The mix skews toward stability rather than diversification: a 9.34% month-over-month lift in an 89.40% Flower base tilts near-term outcomes more than a 62.14% month-over-month jump in 6.61%-share Pre-Rolls, and a 17.38% month-over-month pullback in 2.80%-share Concentrates erodes the prior 214.84% year-over-year gain. Combined with a 50.59% month-over-month contraction in 1.19%-share Vapor Pens and a 1.93% year-over-year dip in average price, the setup implies pricing is not the primary lever and that reinforcing Flower velocity in Missouri—rather than relying on smaller categories—offers the clearest path to improving the current rank of 28 and reversing the 36.71% two-year sales contraction.
Competitive Landscape
C4 / Carroll County Cannabis Co. sits at rank #28 in June 2026, down 6 positions year over year from #22 and up 8 positions since March 2026 from #36, signaling a rebound within the quarter despite a longer-term slide from a peak of #13 in September 2024; meanwhile, Flora Farms held #1 with a -5.1% year-over-year sales change while maintaining top rank, and Sinse Cannabis advanced from #5 to #2 with +33.2% YoY sales growth, indicating that C4’s mid-pack position is pressured by faster climbers but near-term rank gains imply momentum that could be converted into share recovery if sustained into July 2026 and August 2026.

Notable Products
Super Lemon Haze (3.5g) posted the standout move in June 2026 with a +72.5% month-over-month surge, climbing into rank 3, while Indica Blend Shake (14g) slipped by -12.2% to rank 4. Blue Dream (3.5g) added breadth with a +34.4% gain at rank 9, and five of the top ten SKUs are Flower, signaling concentration around inhalable formats. The mix of one premium upswing above +70% alongside a double-digit decline under -10% implies C4 / Carroll County Cannabis Co. is tilting toward higher-velocity 3.5g strains while de-emphasizing value shake, positioning inventory toward faster-turning Flower.
Top Selling Cannabis Brands
Data for this report comes from real-time sales reporting by participating cannabis retailers via their point-of-sale systems, which are linked up with Headset’s business intelligence software. Headset’s data is very reliable, as it comes digitally direct from our partner retailers. However, the potential does exist for misreporting in the instance of duplicates, incorrectly classified products, inaccurate entry of products into point-of-sale systems, or even simple human error at the point of purchase. Thus, there is a slight margin of error to consider. Brands listed on this page are ranked in the top twenty within the market and product category by total retail sales volume.

