May-2026
Sales
Trend
6-Month
Product Count
SKUs
Avg Price
YoY Sales Change
YoY Price Change
Market Insights Snapshot
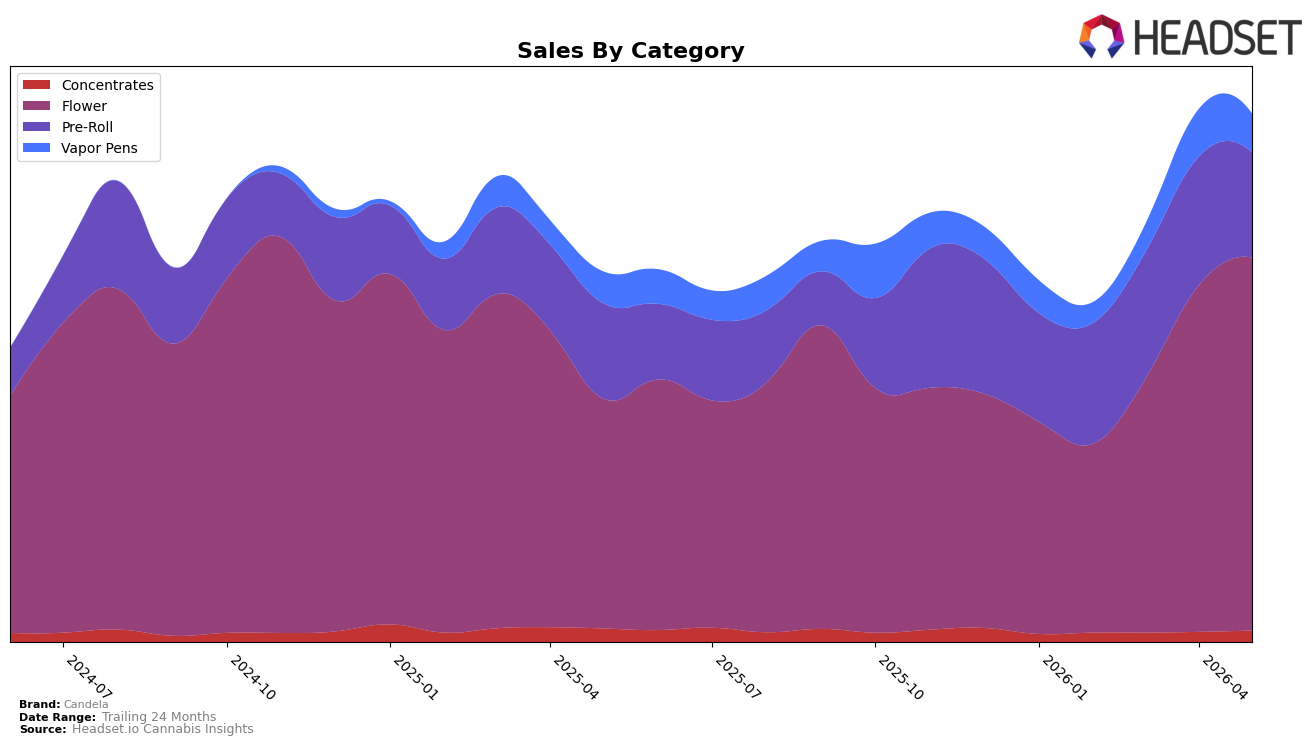
Candela’s category mix in May 2026 tilted further toward Flower at 70.67% share, with year-over-year sales up 62.39% and month-over-month up 7.70%, while the brand’s average price fell 6.08% YoY. Pre-Roll held 19.88% share with a 10.41% YoY increase but a 18.38% MoM decline, indicating near-term softness versus Flower’s MoM gain of 7.70%. Vapor Pens accounted for 7.30% share with 22.35% YoY growth but a 18.68% MoM drop, contrasting with Concentrates’ 13.28% MoM rise despite a 15.48% YoY decline and just 2.15% share. With brand-wide sales up 42.79% YoY and Flower ranked 29 in Michigan, the pattern implies Candela is consolidating volume in Flower while trimming price to sustain traffic, with mixed short-term momentum across inhalable subcategories.
The shift toward a 70.67% Flower mix, alongside a 7.70% MoM lift in that category while Pre-Roll and Vapor Pens fell 18.38% and 18.68% MoM respectively, implies portfolio dependence on core dried formats rather than evenly balanced inhalables. The 62.39% YoY Flower surge paired with a 6.08% brand-wide price decline suggests a scale strategy prioritizing unit velocity over margin per unit, positioning Candela as a high-volume Flower player while using Concentrates’ 13.28% MoM uptick as a niche hedge despite its 15.48% YoY contraction. Given the rank of 29 in Michigan Flower and a 42.79% overall YoY sales increase, the implication is a push to climb category rankings through share gains in Flower while accepting volatility in smaller categories during that reallocation.
Competitive Landscape
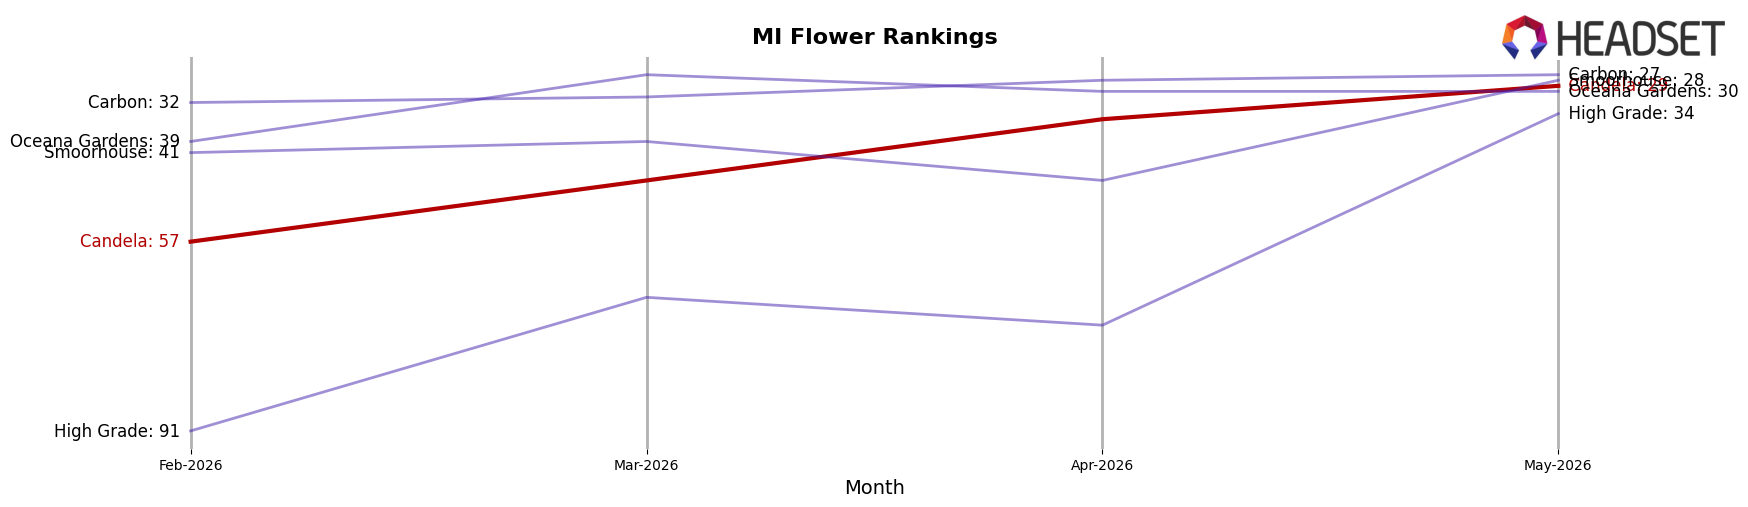
Candela sits at rank #29 in MI Flower in May 2026, improving 25 positions from #54 year over year and 28 positions from #57 three months ago, marking a new peak rank at #29 in May 2026; by contrast, Goodlyfe Farms climbed from #7 to #2 while posting a 66.2% YoY sales change, and Society C held near the top shifting from #2 to #3 despite a -17.6% YoY sales decline. Meanwhile, High Minded stayed #1 year over year with a -14.5% YoY sales change and Grown Rogue surged from #29 to #5 alongside a 245.9% YoY increase, indicating that Candela’s rapid ascent into the top 30 is driven more by recent execution than category tailwinds and implies headroom to consolidate share if the upward rank momentum persists.
Notable Products
Animal Tree (3.5g) delivered the headline move in May 2026 with a +258.7% month-over-month surge to about $80,059 and a jump to rank 1, while Lemon Oreoz (3.5g) also spiked +116.2% to rank 4. Munyunz Pre-Roll (1g) advanced +64.2% to rank 2, but three Pre-Rolls only occupy ranks 2, 9, and 10, indicating momentum is concentrated in Flower. The pattern implies Candela’s product mix is tilting toward higher-velocity Flower SKUs, with outsized gains at the top end pulling share away from smaller Pre-Roll placements.
Top Selling Cannabis Brands
Data for this report comes from real-time sales reporting by participating cannabis retailers via their point-of-sale systems, which are linked up with Headset’s business intelligence software. Headset’s data is very reliable, as it comes digitally direct from our partner retailers. However, the potential does exist for misreporting in the instance of duplicates, incorrectly classified products, inaccurate entry of products into point-of-sale systems, or even simple human error at the point of purchase. Thus, there is a slight margin of error to consider. Brands listed on this page are ranked in the top twenty within the market and product category by total retail sales volume.

