Jun-2026
Sales
Trend
6-Month
Product Count
SKUs
Avg Price
YoY Sales Change
YoY Price Change
Market Insights Snapshot
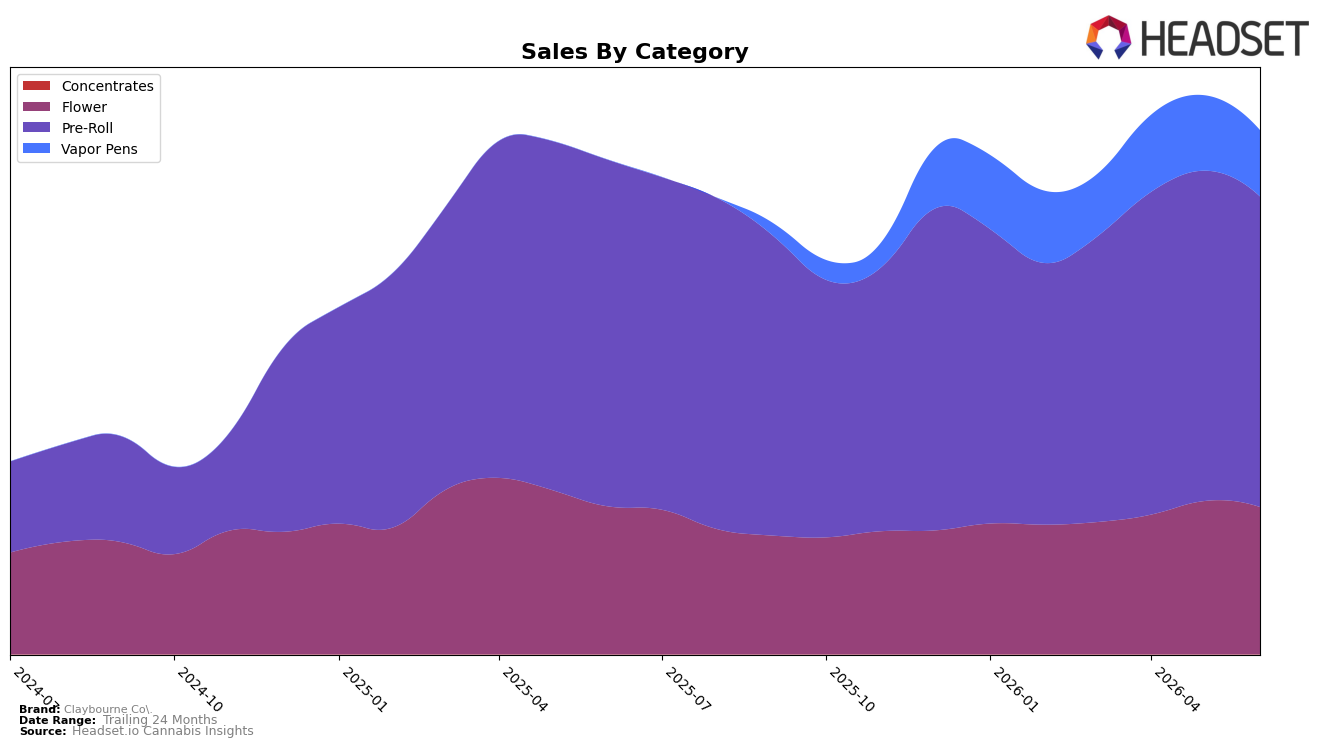
Claybourne Co.'s category mix in June 2026 centered on Pre-Roll at 59.28% share with a year-over-year decline of 10.37% and a month-over-month decline of 5.98%, while Flower held 28.09% share with a 0.44% YoY decline and a 3.94% MoM decline; Vapor Pens accounted for 12.62% share with a 12.05% MoM decline and no YoY baseline, and Concentrates were negligible at 0.00% share despite an 88.73% MoM uptick. Despite brand-level sales rising 5.98% YoY alongside a 1.67% YoY decrease in average price, the concurrent MoM pullbacks in Pre-Roll and Flower indicate reliance on a large, contracting anchor and limited offset from Vapor Pens, implying June’s growth rate is being supported more by pricing/assortment adjustments than by category expansion.
The shifts imply a positioning concentrated in value-accessible inhalables: the average price at $30.99 with a 1.67% YoY decrease contrasts with Flower’s higher $37.97 average and Pre-Roll’s $28.47, suggesting Claybourne Co. is tilting toward price-sensitive volume in Pre-Roll even as its share leader contracted 5.98% MoM and 10.37% YoY; simultaneously, maintaining rank 6 in Flower in California while Flower declined 3.94% MoM and 0.44% YoY signals defensible relevance in a tougher subcategory. The pattern implies the brand is overexposed to Pre-Roll cyclicality and under-penetrated in Vapor Pens at 12.62% share with a 12.05% MoM drop, so sustaining growth will require either stabilizing Pre-Roll mix or reallocating toward Flower where rank 6 affords room to capture share without materially elevating average price.
Competitive Landscape
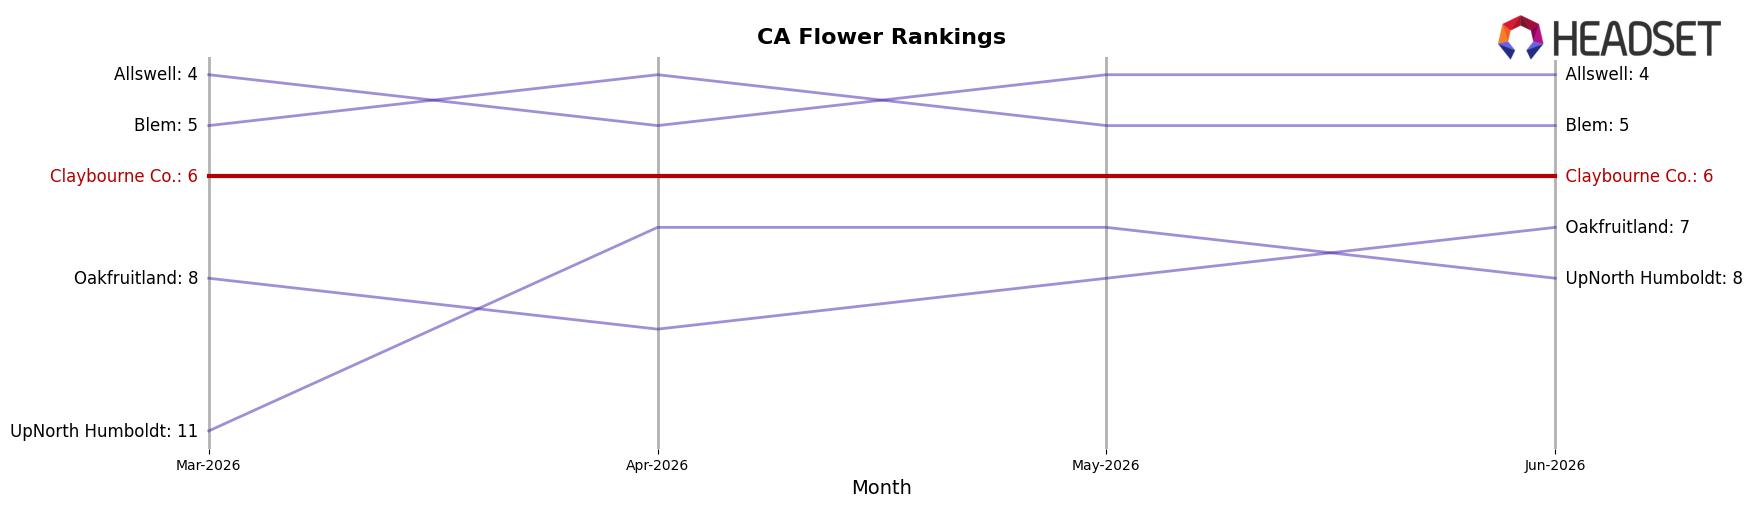
Claybourne Co. sits at rank 6 in June 2026 in CA Flower, down 2 positions year over year from rank 4, while holding flat quarter over quarter at rank 6; that slippage contrasts with STIIIZY advancing from rank 2 to rank 1 alongside a 62.5% YoY sales lift and CAM climbing from rank 3 to rank 2 with a 56.2% YoY increase. The brand’s current standing is also 4 places below its peak at rank 2 in April 2025, and it now trails Blem which moved from rank 6 to rank 5 as CannaBiotix (CBX) slipped from rank 1 to rank 3 with only a 2.4% YoY gain; taken together, Claybourne Co.’s two-rank YoY decline and stalled three-month position imply a need to re-accelerate velocity to prevent further share ceding to faster-rising leaders.
Notable Products
Frosted Flyers - Hybrid Flight Pack Resin Infused Pre-Roll 5-Pack (2.5g) posted the steepest decline in June 2026 at -14.8% and slid to rank 4, while Frosted Flyers - Variety Pack Infused Pre-Roll 5-Pack (2.5g) fell -14.5% yet held rank 1 with $1,262,399, indicating pressure concentrated at the high-volume end. Across the leaderboard, five of the top ten are Flyers or Frosted Flyers Pre-Rolls, with the Flyers - Blue Dream Frosted Liquid Diamond Infused Pre-Roll 8-Pack (2.8g) up 15.5% at rank 7 and the 3-Pack at rank 2 down -5.0%, a split that suggests pack architecture and format are driving divergent outcomes. The concentration of infused Pre-Rolls at ranks 1–5 alongside modest Flower gains of 1.5% at rank 6 and 16.2% at rank 8 implies the franchise remains anchored in multi-pack infused formats but is quietly diversifying share into select Flower SKUs.
Top Selling Cannabis Brands
Data for this report comes from real-time sales reporting by participating cannabis retailers via their point-of-sale systems, which are linked up with Headset’s business intelligence software. Headset’s data is very reliable, as it comes digitally direct from our partner retailers. However, the potential does exist for misreporting in the instance of duplicates, incorrectly classified products, inaccurate entry of products into point-of-sale systems, or even simple human error at the point of purchase. Thus, there is a slight margin of error to consider. Brands listed on this page are ranked in the top twenty within the market and product category by total retail sales volume.

