Apr-2026
Sales
Trend
6-Month
Product Count
SKUs
Avg Price
YoY Sales Change
YoY Price Change
Market Insights Snapshot
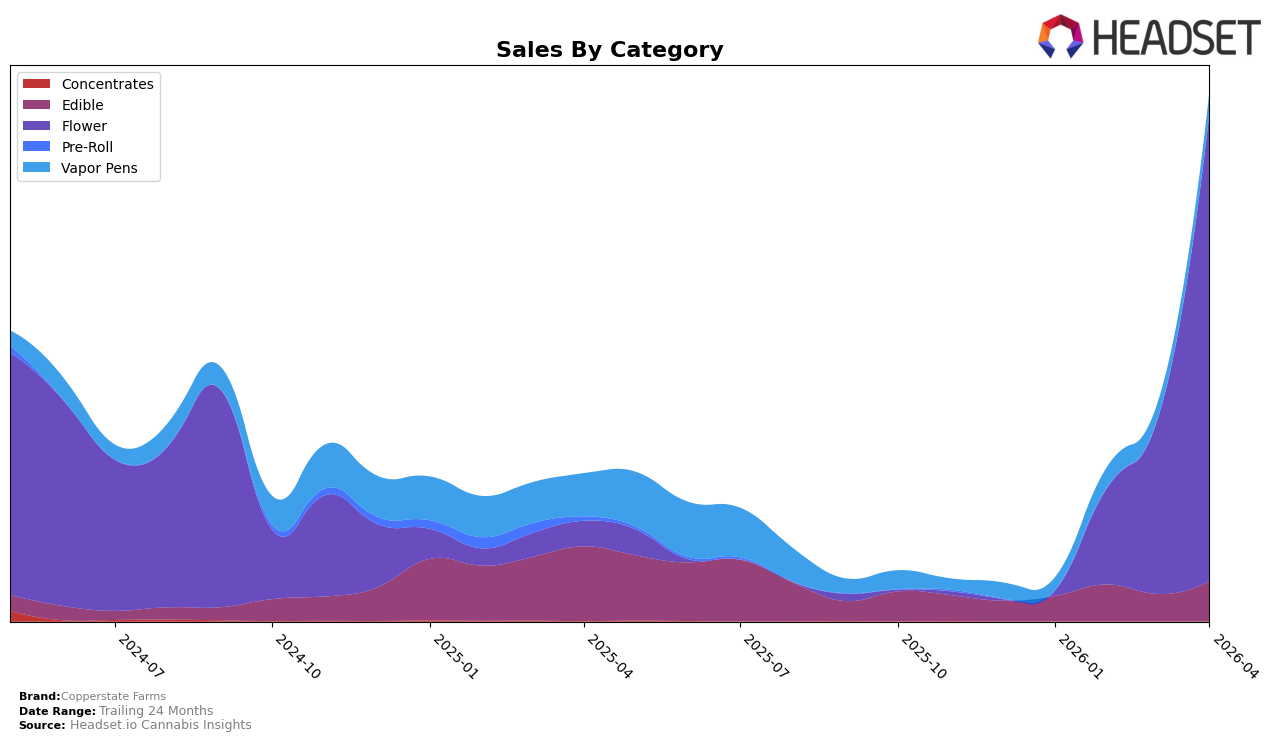
Copperstate Farms has shown notable performance variations across different product categories in Arizona. In the Edible category, the brand has consistently hovered around the top 30, with rankings fluctuating from 35th in January to 33rd in April. This upward movement is reflected in their sales, which increased from $26,059 in January to $41,709 in April, indicating a positive trend in consumer preference for their edibles. However, despite these gains, the brand has not yet secured a stronghold in the top 30, which may suggest room for growth or the need for strategic adjustments in this category.
In contrast, Copperstate Farms has experienced a significant upward trajectory in the Flower category within the same state. Starting from outside the top 30 in January, the brand made a remarkable leap to 18th place by April. This improvement is underscored by a substantial increase in sales, with the brand achieving $488,287 in April. Such a jump in rankings and sales indicates a strong consumer demand and effective market penetration in this category. Meanwhile, in the Vapor Pens category, Copperstate Farms has maintained a more stable presence, with rankings slightly improving from 65th in January to 58th in April. Although not as dramatic as the Flower category, this steady performance could suggest a consistent customer base for their vapor products.
Competitive Landscape
In the competitive landscape of the Arizona flower category, Copperstate Farms has shown a remarkable upward trajectory in recent months. After not ranking in January 2026, Copperstate Farms surged to the 48th position in February, climbed to 41st in March, and impressively broke into the top 20 by April, achieving 18th place. This ascent is indicative of a significant increase in sales momentum, as seen in the substantial jump from February's sales figures to those in April. In contrast, Aeriz maintained a steady presence in the top 20, moving from 27th in January to 17th in April, suggesting consistent performance. Meanwhile, Sonoran Roots also demonstrated resilience, peaking at 17th in March before settling at 19th in April. Drip Oils + Extracts consistently ranked in the mid-teens, while Flavors Cannabis Co. fluctuated, peaking at 20th in April. Copperstate Farms' rapid rise in rank and sales highlights its growing influence and competitive edge in the Arizona flower market.

Notable Products
In April 2026, the top-performing product for Copperstate Farms was Gaschata #5 (14g) in the Flower category, securing the number one rank with notable sales of 3713 units. Bubba Star Dog (14g) maintained its position as the second best-seller from March to April, with sales increasing significantly to 3562 units. Original Skunk #1 (14g) also held steady in third place, showing a consistent performance with 3249 units sold. Gastro Pop #4 (14g) experienced a drop from first place in February to fourth in April, suggesting a shift in consumer preference. Peacemaker (14g) entered the top five in April, indicating a growing interest in this product among consumers.
Top Selling Cannabis Brands
Data for this report comes from real-time sales reporting by participating cannabis retailers via their point-of-sale systems, which are linked up with Headset’s business intelligence software. Headset’s data is very reliable, as it comes digitally direct from our partner retailers. However, the potential does exist for misreporting in the instance of duplicates, incorrectly classified products, inaccurate entry of products into point-of-sale systems, or even simple human error at the point of purchase. Thus, there is a slight margin of error to consider. Brands listed on this page are ranked in the top twenty within the market and product category by total retail sales volume.

