.svg)

Sep-2026
Sales
Trend
6-Month
Product Count
SKUs
Avg Price
YoY Sales Change
YoY Price Change


Market Insights Snapshot
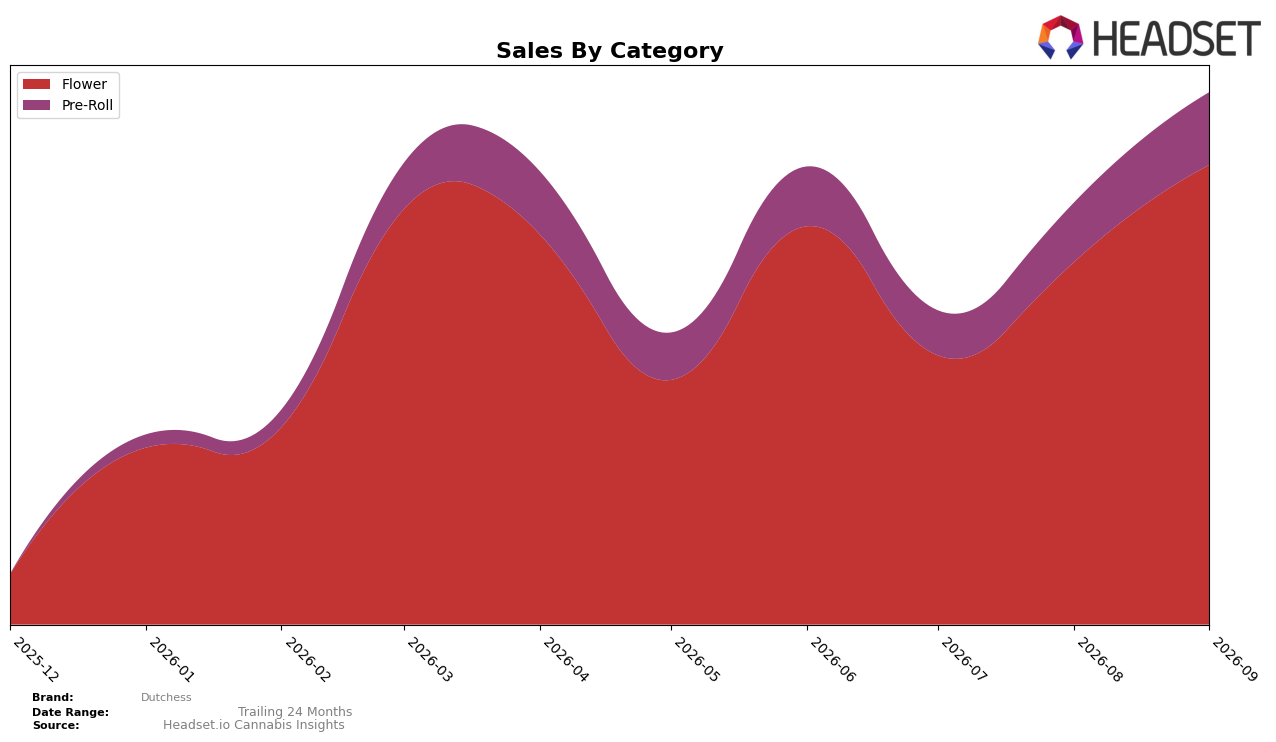
In September 2026, Dutchess concentrated 86.29% of sales in Flower while Pre-Roll accounted for 13.71%, with Flower expanding month over month by 26.92% and Pre-Roll up 21.87%. The average price diverged sharply across the mix at $19.45 in Flower versus an implied blended average of $13.06, indicating a lower-priced Pre-Roll drag and a premiumized Flower core; given a Flower rank of 19 in Massachusetts, the month-over-month lift in Flower outpaced Pre-Roll by 5.04 percentage points, implying that short-term share gains are being driven more by depth in Flower than breadth across formats.
The September 2026 mix and rank position imply Dutchess is competing primarily on Flower scale, not on a two-category balance, as a 26.92% Flower uptick alongside 13.71% total share for Pre-Roll concentrates demand and risks volatility if Flower growth normalizes; holding rank 19 in Massachusetts Flower while Pre-Roll grows at 21.87% month over month suggests the brand can convert incremental Pre-Roll gains into a hedge without diluting the Flower price architecture at $19.45. The combined effect—Flower share at 86.29% and a 5.04 percentage-point growth gap versus Pre-Roll—implies near-term positioning as a Flower-led operator with optionality in value-entry Pre-Rolls rather than a diversified portfolio play.
Competitive Landscape
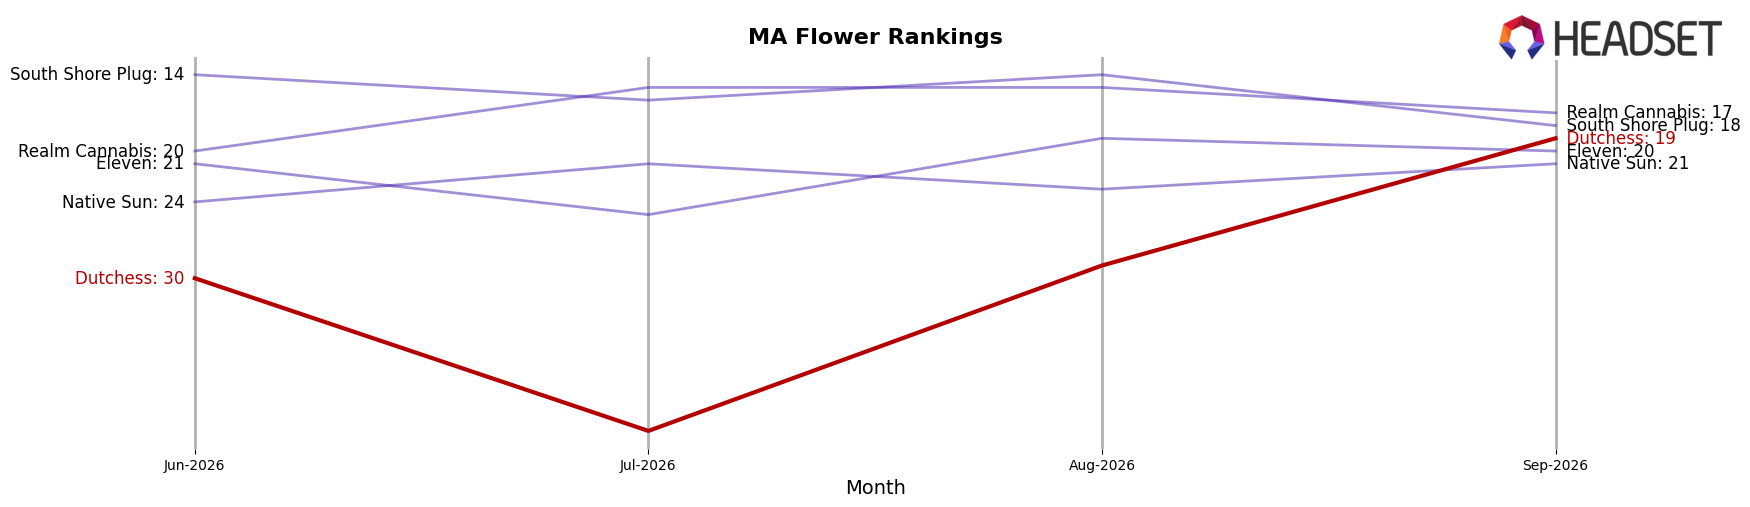
Dutchess is ranked #19 in MA Flower in September 2026, improving 11 positions from #30 in June 2026, and setting a peak rank of #19 in September 2026 while moving from outside the top 25 to inside the top 20 within one quarter; in contrast, Perpetual Harvest climbed year over year from #5 to #1 and expanded sales by 124.1%, and Simply Herb slipped from #1 to #3 with a 16.6% sales decline. This trajectory implies Dutchess is transitioning from fringe presence to viable contender in the mid-tier, with recent rank momentum outpacing declining incumbents but still trailing the leaders’ double-digit share gains.
Notable Products
Founding Fathah (28g) posted the largest movement in September 2026 with a +327% month-over-month surge that vaulted it to rank 2, while Skanky Skunk Pre-Roll (1g) fell 65% MoM to rank 8, marking the steepest decline. Baked Stuffed Lobstah Pre-Roll (1g) also jumped +144% MoM to rank 3, and four of the top ten are Pre-Roll SKUs clustered at ranks 1, 3, 4, and 8, indicating a split portfolio where volatility sits in Pre-Rolls while Flower concentrates the dollar volume near the top. With Founding Fathah (28g) adding roughly $80,318 and Mental Bakedown (3.5g) up 23% at rank 10, the mix implies Dutchess is tilting toward higher-weight Flower wins while using Pre-Roll spikes to generate short-cycle traffic.
Top Selling Cannabis Brands






Data for this report comes from real-time sales reporting by participating cannabis retailers via their point-of-sale systems, which are linked up with Headset’s business intelligence software. Headset’s data is very reliable, as it comes digitally direct from our partner retailers. However, the potential does exist for misreporting in the instance of duplicates, incorrectly classified products, inaccurate entry of products into point-of-sale systems, or even simple human error at the point of purchase. Thus, there is a slight margin of error to consider. Brands listed on this page are ranked in the top twenty within the market and product category by total retail sales volume.

