Jun-2026
Sales
Trend
6-Month
Product Count
SKUs
Avg Price
YoY Sales Change
YoY Price Change
Market Insights Snapshot
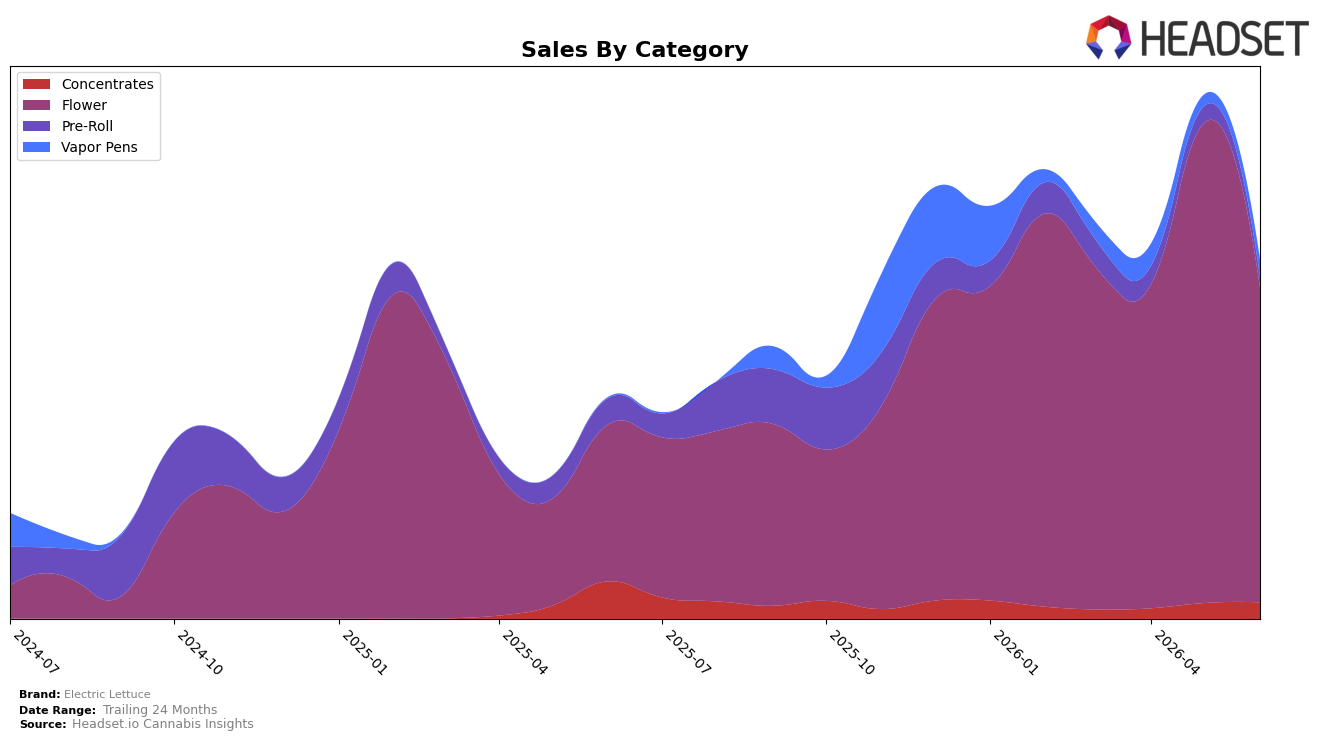
Electric Lettuce concentrated 87.74% of June 2026 sales in Flower, where year-over-year sales rose 100.83% but month-over-month fell 34.55%, while Pre-Roll slipped to a 2.95% share with a 59.32% YoY decline and a 35.65% MoM drop. Vapor Pens expanded to a 4.83% share on 2,047.80% YoY growth and 53.49% MoM growth, contrasting with Concentrates at a 4.48% share with a 56.75% YoY contraction and a 3.85% MoM uptick. With Flower ranked 16th in Saskatchewan and the category mix tilting toward higher-ticket items as the average price climbed 165.89% YoY to $74.37, the pattern implies a reliance on a premium-leaning Flower core that is vulnerable to monthly volatility even as smaller formats test new demand pockets.
Across June 2026, the combination of a 62.54% brand sales YoY increase and a 34.55% MoM pullback in the dominant Flower category suggests that Electric Lettuce’s growth engine is efficient annually but exposed to short-cycle demand swings. The surge in Vapor Pens share to 4.83% alongside Concentrates’ 56.75% YoY decline indicates portfolio polarization toward accessible inhalables with faster adoption while legacy extract formats recede; positioned in Saskatchewan at rank 16 in Flower, the brand can trade up where pricing power exists and buffer MoM shocks by scaling the emerging Vapor Pens contribution.
Competitive Landscape
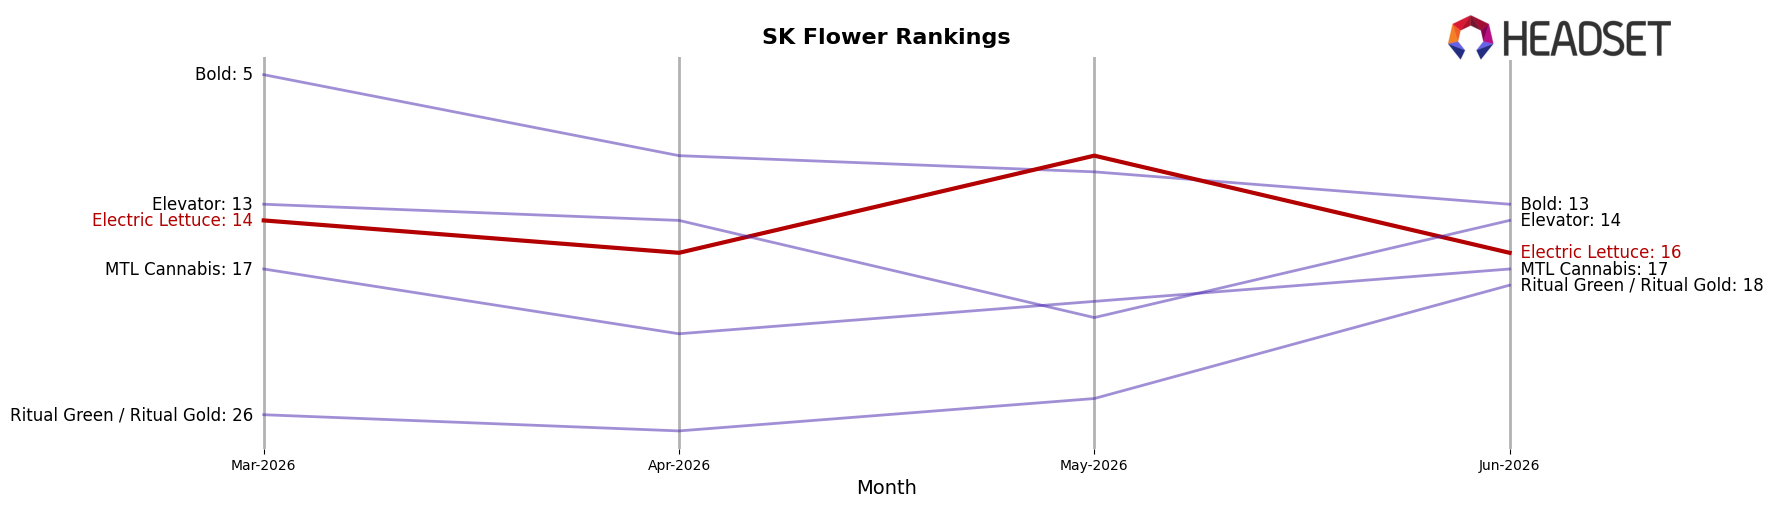
Electric Lettuce sits at rank #16 in SK Flower in June 2026, improving 14 positions year over year from #30 and slipping 2 spots since March 2026 from #14; that mix contrasts with a peak at #10 in May 2026 and a current position 6 places below that peak, indicating recent cooling after a brief high. Meanwhile, Back Forty / Back 40 Cannabis held at #1 year over year and remains #1 in June 2026, while Weed Me reached #5 from #44 with a 1,376.9% YoY sales gain, outpacing Electric Lettuce’s mid-pack movement by both rank velocity and sales momentum; Big Bag O' Buds advanced from #4 to #2 with 55.7% YoY growth, tightening pressure at the top. The pattern—large YoY climb but a 2-rank quarter-over-quarter dip alongside peers accelerating upward—implies Electric Lettuce is recovering structurally but losing short-term share of voice to faster risers.
Notable Products
Charged Indica Pre Roll 10-Pack (5g) posted the steepest decline in June 2026 at -53.1% while sliding to rank 8, contrasting with Toasted Vanilla Distillate Cartridge (1g) which jumped +69.0% to rank 3. Electric Blend Milled (28g) kept the top spot at rank 1 despite a -31.3% pullback, and Lemon Supreme Diesel (28g) fell -40.2% to rank 5. With three Flower SKUs in the top 10 but only one gaining item among non-Flower leaders, the mix points to volatility away from bulk Flower and a pivot opportunity into Vapor Pens where momentum is accelerating.
Top Selling Cannabis Brands
Data for this report comes from real-time sales reporting by participating cannabis retailers via their point-of-sale systems, which are linked up with Headset’s business intelligence software. Headset’s data is very reliable, as it comes digitally direct from our partner retailers. However, the potential does exist for misreporting in the instance of duplicates, incorrectly classified products, inaccurate entry of products into point-of-sale systems, or even simple human error at the point of purchase. Thus, there is a slight margin of error to consider. Brands listed on this page are ranked in the top twenty within the market and product category by total retail sales volume.

