.svg)

Sep-2026
Sales
Trend
6-Month
Product Count
SKUs
Avg Price
YoY Sales Change
YoY Price Change


Where to Buy
Everest (AZ) is stocked at 10 licensed dispensaries across Michigan and Arizona, 8 of them in Michigan, with the deepest coverage in Detroit, Hazel Park, Mount Morris, New Buffalo, and Romeo. Search by ZIP code or city below to find the closest one, or filter by product type if you are after a specific format.
Market Insights Snapshot
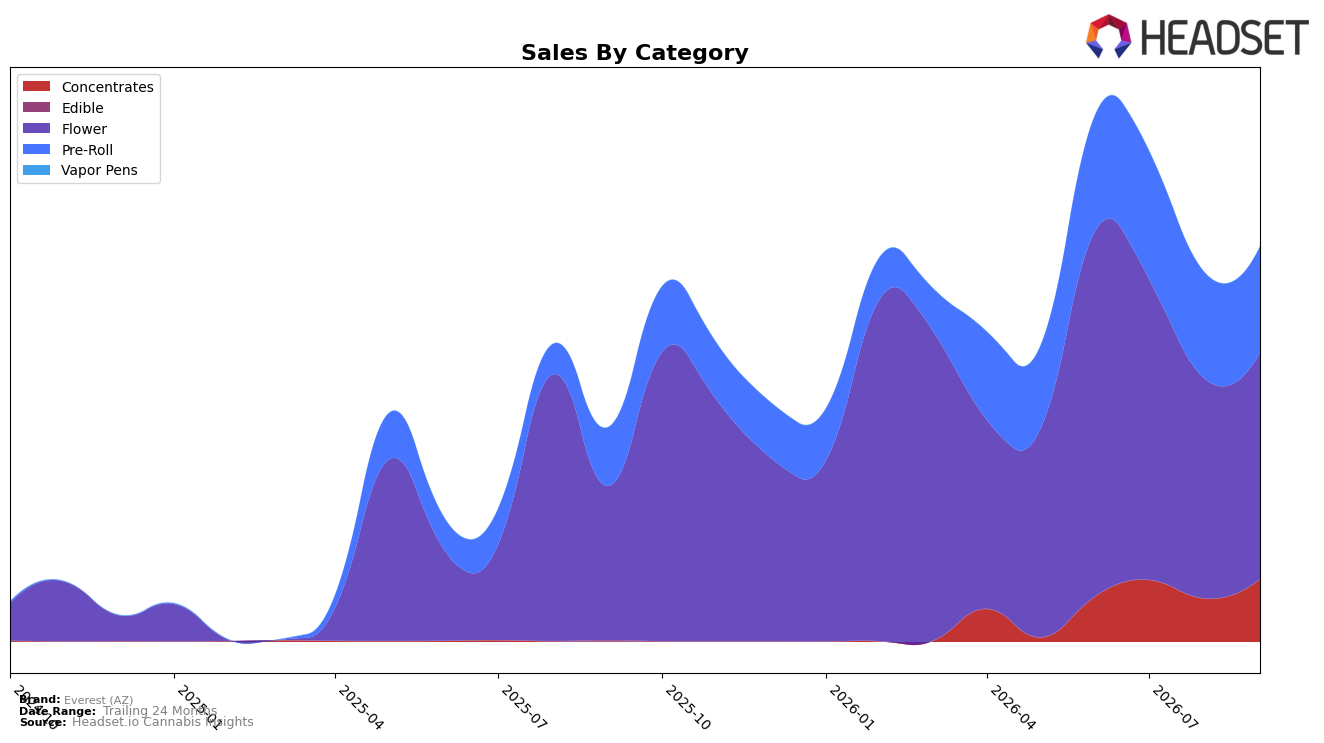
Everest (AZ) concentrated 57.28% of September 2026 sales in Flower with a 2.97% month-over-month lift and 46.68% year-over-year growth, while Pre-Roll held 26.89% share with a -0.01% MoM dip but 81.23% YoY growth; Concentrates expanded to 15.84% share on a 45.28% MoM surge and a triple-digit YoY jump exceeding 100,000%. Average price fell 17.32% YoY to $44.22 as category-level price points diverged (Flower at $68.65 vs. Pre-Roll at $22.46), implying mix-driven unit expansion alongside premium-to-value rebalancing; the pattern points to a portfolio tilting away from pure Flower dependence toward a three-pillar mix where Concentrates is the incremental growth engine.
With Flower still the largest share at 57.28% but a rank of 31 in Flower within Alberta, the 45.28% MoM surge in Concentrates and 81.23% YoY in Pre-Roll suggest repositioning headroom in formats that scale faster than the core. The combination of an 84.65% brand-level YoY sales increase and a 17.32% YoY price decline indicates volume-led growth that can support deeper penetration in Pre-Roll and Concentrates without overexposing to Flower’s rank-constrained lane; this implies the brand’s near-term positioning should prioritize breadth in inhalable formats where share gains compound even if Flower’s rank remains in the low-30s.
Competitive Landscape
Everest (AZ) sits at #31 in AB Flower in September 2026, improving 13 spots from #44 year over year, but dropping 11 positions from #20 three months ago; the brand’s peak at #18 in February 2026 indicates a 13-rank slide from its high-water mark. Competitors show mixed direction: Back Forty / Back 40 Cannabis advanced from #2 to #1 while posting a -6.7% sales change year over year, and Pure Sunfarms moved from #5 to #3 with +10.2% YoY growth, whereas Good Supply fell from #1 to #5 alongside a -43.0% YoY decline; this mix suggests Everest (AZ)’s YoY climb reflects room to recapture share lost since February 2026 rather than broad category tailwinds.

Notable Products
Iced Peach Pre-Roll (1g) posted the steepest decline at -26.7% MoM and slid to rank 4, while Ego Checker Pre-Roll (1g) surged 60.5% MoM to rank 2, indicating consumers are rotating within the Pre-Roll lineup rather than expanding the segment. Four of the top ten are Pre-Roll SKUs, yet the category leader Ego Checker Pre-Roll 3-Pack (3g) dipped -8.1% at rank 1 as single-count formats gained share, implying price-point and pack-size experimentation is redistributing demand rather than lifting total Pre-Roll velocity.
On the Flower side, Dante's Inferno (3.5g) rose 38.1% MoM to rank 5 and Dante's Inferno #8 (3.5g) added 6.6% at rank 7, while Grape Gas (3.5g) fell -15.2% to rank 9, signaling concentration around the Dante's Inferno family as secondary strains lose traction. With Concentrates entering the top 10 via Zeclair Live Hash Rosin (1g) and Strawberry Cookie Live Hash Rosin (1g) alongside a single-month revenue of $71,288 for Dante's Inferno #8 (14g) at rank 3, the mix points to a portfolio tilting toward a few flagship genetics and selective format bets rather than broad-based SKU expansion.
Top Selling Cannabis Brands






Data for this report comes from real-time sales reporting by participating cannabis retailers via their point-of-sale systems, which are linked up with Headset’s business intelligence software. Headset’s data is very reliable, as it comes digitally direct from our partner retailers. However, the potential does exist for misreporting in the instance of duplicates, incorrectly classified products, inaccurate entry of products into point-of-sale systems, or even simple human error at the point of purchase. Thus, there is a slight margin of error to consider. Brands listed on this page are ranked in the top twenty within the market and product category by total retail sales volume.

