.svg)

Aug-2026
Sales
Trend
6-Month
Product Count
SKUs
Avg Price
YoY Sales Change
YoY Price Change


Market Insights Snapshot
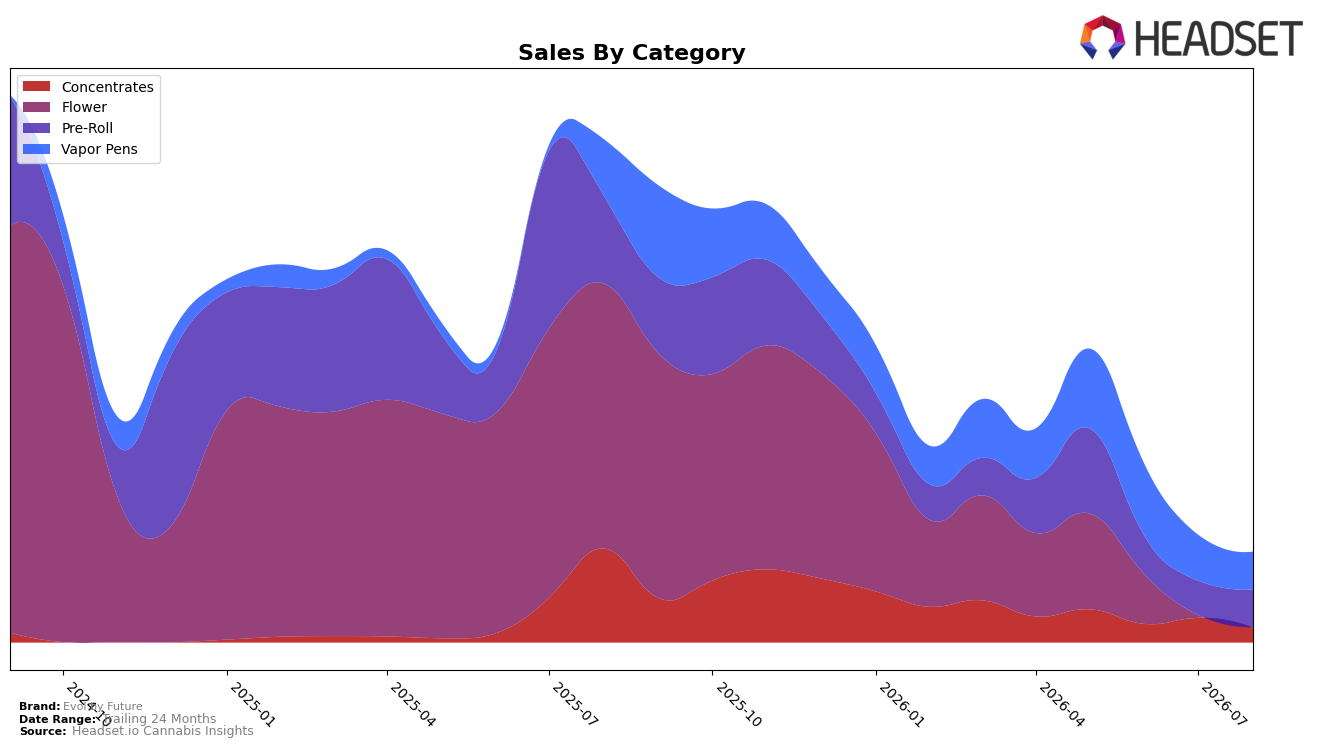
In August 2026, Evol by Future split nearly evenly between Vapor Pens at 41.86% share and Pre-Roll at 41.83%, with Concentrates at 16.31%, but the trajectories diverged: Vapor Pens fell 33.41% year over year and 18.06% month over month, while Pre-Roll declined 57.16% year over year yet grew 10.78% month over month; Concentrates contracted 84.42% year over year and 40.12% month over month. The average price dropped 5.98% year over year to $23.17, while Vapor Pens commanded a $39.01 average versus $16.14 in Pre-Roll, implying mix pressure as higher-priced units shrink and lower-priced units recover, and indicating that August 2026 marked a pivot toward lower-ticket volume even as overall brand sales fell 82.17% year over year.
The category split and rank position signal a narrowing relevance in high-value segments: Vapor Pens hold the largest share at 41.86% but carry a 33.41% year-over-year and 18.06% month-over-month decline alongside a rank of 92 in Illinois Vapor Pens, whereas Pre-Roll’s 10.78% month-over-month gain offsets some volume with a 57.16% year-over-year drag. With Concentrates retreating 84.42% year over year and 40.12% month over month, the mix shifts toward lower-price Pre-Rolls and away from premium-priced formats, implying that Evol by Future’s near-term positioning skews to value-led recovery in Pre-Rolls while ceding rank headroom in Vapor Pens within Illinois.
Competitive Landscape
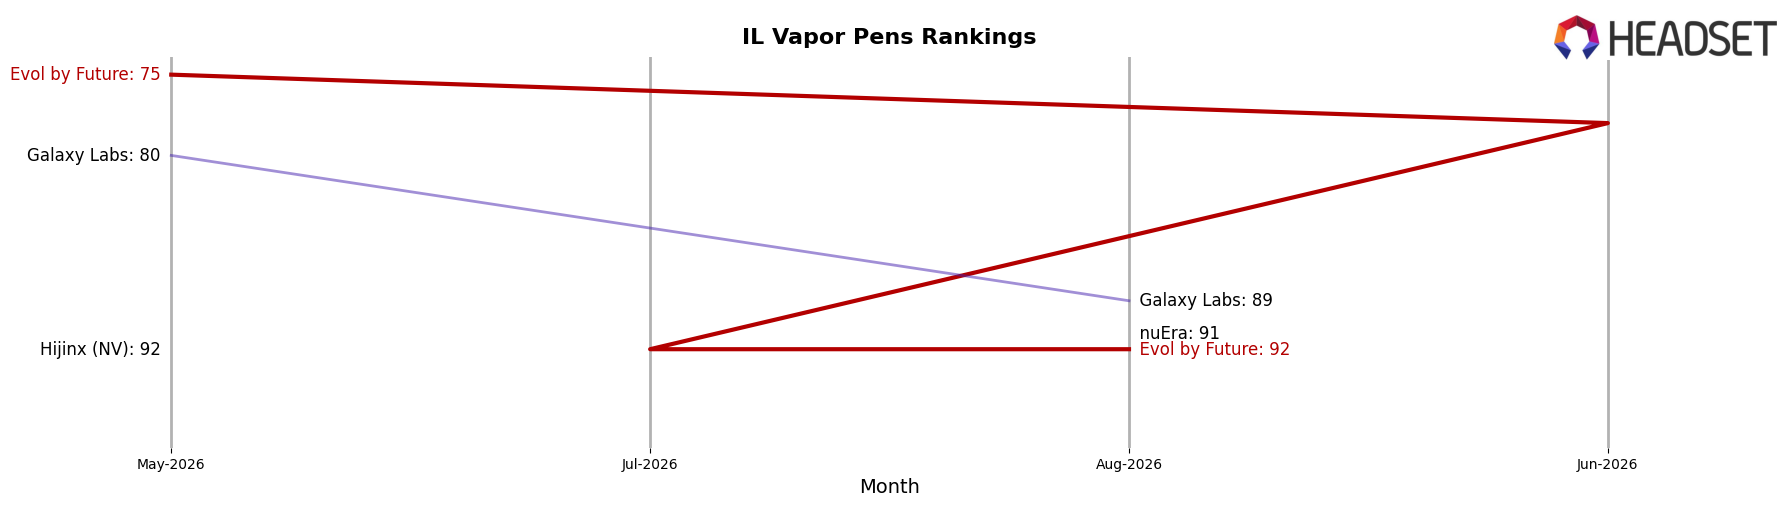
Evol by Future is currently ranked #92 in IL Vapor Pens, dropping 10 positions from #82 year over year and falling 17 positions from its peak at #75 in May 2026 to #92 in August 2026; over the last three months it slid from #75 to #92, a 17-rank decline. In contrast, Fernway jumped from #47 to #3 while posting a 2029.0% year-over-year sales gain, and RYTHM advanced from #7 to #4 alongside a 58.8% increase, indicating that Evol by Future’s downward rank trajectory coincides with competitors consolidating share at the top. The pattern implies that without a shift in velocity or distribution, the brand’s multi-month rank decline will continue to widen the gap versus rising leaders.
Notable Products
Ice Attack Hash Infused Pre-Roll (1.5g) delivered the month’s standout surge with +708.9% month over month to rank 1, while the same Ice Attack line’s Live Resin Disposable (1g) slipped 6.1% to rank 2. Notorious #1 Hash Infused Pre-Roll (1.5g) fell 52.4% to rank 3 and Ice Attack Live Sugar (1g) dropped 54.2% to rank 4, indicating volatility concentrated at the top of the chart. With four of the top ten in Pre-Roll and three in Vapor Pens, the mix tilts toward inhalables even as performance diverges; this points to a pivot toward hero SKUs in Pre-Rolls as the primary traffic driver, with disposables acting as a secondary, more elastic volume lever.
Top Selling Cannabis Brands






Data for this report comes from real-time sales reporting by participating cannabis retailers via their point-of-sale systems, which are linked up with Headset’s business intelligence software. Headset’s data is very reliable, as it comes digitally direct from our partner retailers. However, the potential does exist for misreporting in the instance of duplicates, incorrectly classified products, inaccurate entry of products into point-of-sale systems, or even simple human error at the point of purchase. Thus, there is a slight margin of error to consider. Brands listed on this page are ranked in the top twenty within the market and product category by total retail sales volume.

