.svg)


Where to Buy
Exotic Genetix is stocked at 54 licensed dispensaries across Michigan, with the deepest coverage in Detroit, New Buffalo, Monroe, Kalamazoo, and Adrian. Search by ZIP code or city below to find the closest one, or filter by product type if you are after a specific format.
Market Insights Snapshot
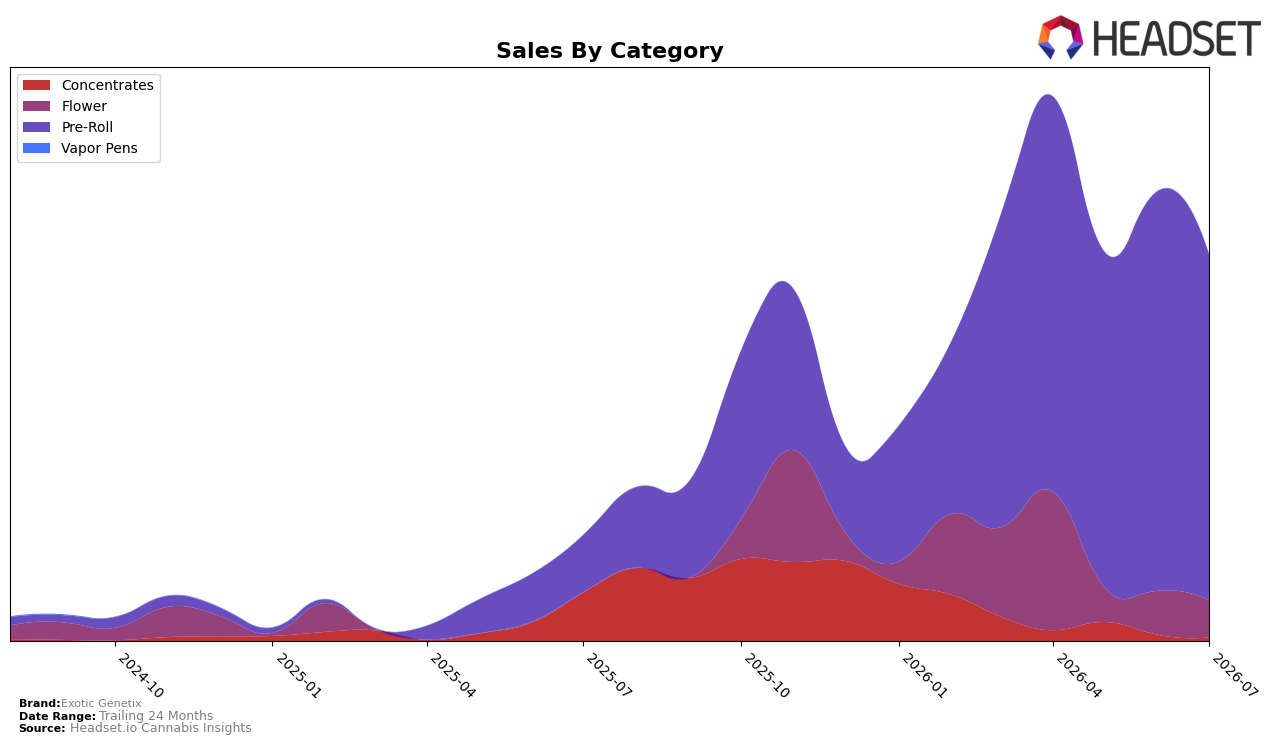
Exotic Genetix concentrated 89.56% of July 2026 sales in Pre-Roll, while Flower held 9.54% and Concentrates just 0.90%, indicating a narrowed focus even as Pre-Roll posted 509.79% year-over-year growth alongside a 13.46% month-over-month decline. Flower decreased 15.38% month-over-month and Concentrates contracted 43.77% month-over-month with a 92.78% year-over-year drop, occurring as the brand’s average price fell 48.64% year-over-year and overall brand sales grew 267.89% year-over-year. The thesis is that Exotic Genetix’s growth in July 2026 was driven by a deep pivot into low-priced Pre-Rolls, while sequential softness and shrinkage in smaller categories suggest volatility tied to discount-led volume rather than balanced category breadth.
With Pre-Roll at rank 46 in Michigan during July 2026 and commanding 89.56% mix, the brand’s positioning skews toward value-led visibility within a crowded tier, as evidenced by a 13.46% month-over-month pullback despite the 509.79% year-over-year surge. The 9.54% Flower share paired with a 15.38% month-over-month decline and a 0.90% Concentrates share with a 92.78% year-over-year contraction imply limited insulation from Pre-Roll swings, and the 48.64% year-over-year price reduction signals a strategy anchored in price elasticity rather than premium differentiation. The thesis is that maintaining or improving rank 46 will likely depend on sustaining promotional efficiency in Pre-Rolls while selectively rebuilding Flower for margin stability to reduce dependence on discount-driven throughput.
Competitive Landscape
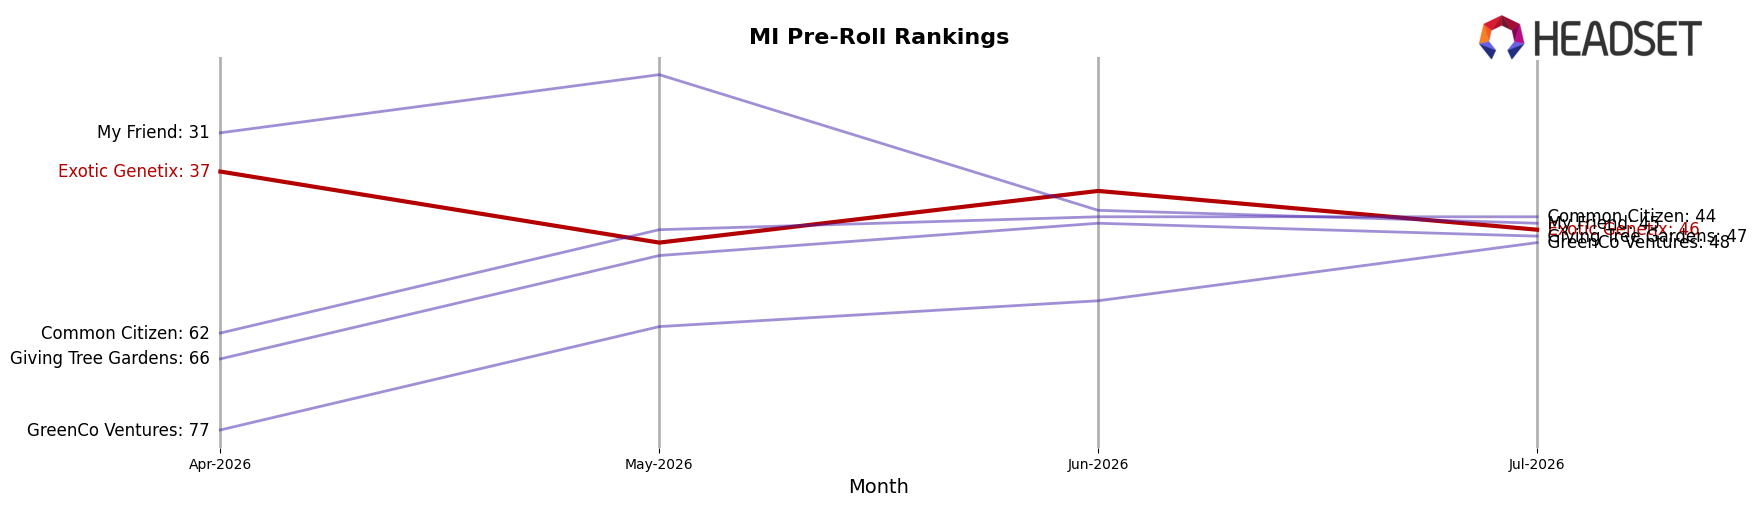
Exotic Genetix sits at rank #46 in Michigan Pre-Roll in July 2026, a 106-position climb from #152 year over year, but down 9 ranks from #37 in April 2026 when it hit its peak, indicating volatility rather than linear momentum. Against the leaders, Jeeter held #1 both year over year and in July 2026 while growing sales 4.0%, and Mitten Extracts advanced from #7 to #4 with 68.5% YoY sales growth, outpacing Exotic Genetix’s rank recovery and compressing headroom near the top. The pattern—sharp YoY rank recovery offset by a 9-rank slide since April 2026—implies Exotic Genetix is gaining baseline relevance but lacks sustained share capture in a tier where leaders are either entrenched or accelerating.
Notable Products
Neon Sunshine Pre-Roll (1g) posted the steepest movement in July 2026 with a -51.8% month-over-month drop and slid to rank 8, while Blue Razz Infused Pre-Roll (1g) also fell -17.4% at rank 3, signaling compression below the top two slots. At the top, Grape Soda Infused Pre-Roll (1g) held rank 1 despite a -5.7% decline and Strawberry Gary Infused Pre-Roll (1g) rose 20.5% to rank 2, creating a two-SKU anchor that contrasts with heavier losses in ranks 6–10. With all top-10 items in the Pre-Roll category and three SKUs each down roughly -50% month over month, the mix implies Exotic Genetix is consolidating around a narrow set of infused winners while legacy and non-infused variants risk losing shelf momentum.
Top Selling Cannabis Brands






Data for this report comes from real-time sales reporting by participating cannabis retailers via their point-of-sale systems, which are linked up with Headset’s business intelligence software. Headset’s data is very reliable, as it comes digitally direct from our partner retailers. However, the potential does exist for misreporting in the instance of duplicates, incorrectly classified products, inaccurate entry of products into point-of-sale systems, or even simple human error at the point of purchase. Thus, there is a slight margin of error to consider. Brands listed on this page are ranked in the top twenty within the market and product category by total retail sales volume.

