.svg)

Aug-2026
Sales
Trend
6-Month
Product Count
SKUs
Avg Price
YoY Sales Change
YoY Price Change


Where to Buy
Falcanna is stocked at 98 licensed dispensaries across Washington and Oklahoma, 92 of them in Washington, with the deepest coverage in Seattle, Bellingham, Tacoma, Everett, and Mount Vernon. Search by ZIP code or city below to find the closest one, or filter by product type if you are after a specific format.
Market Insights Snapshot
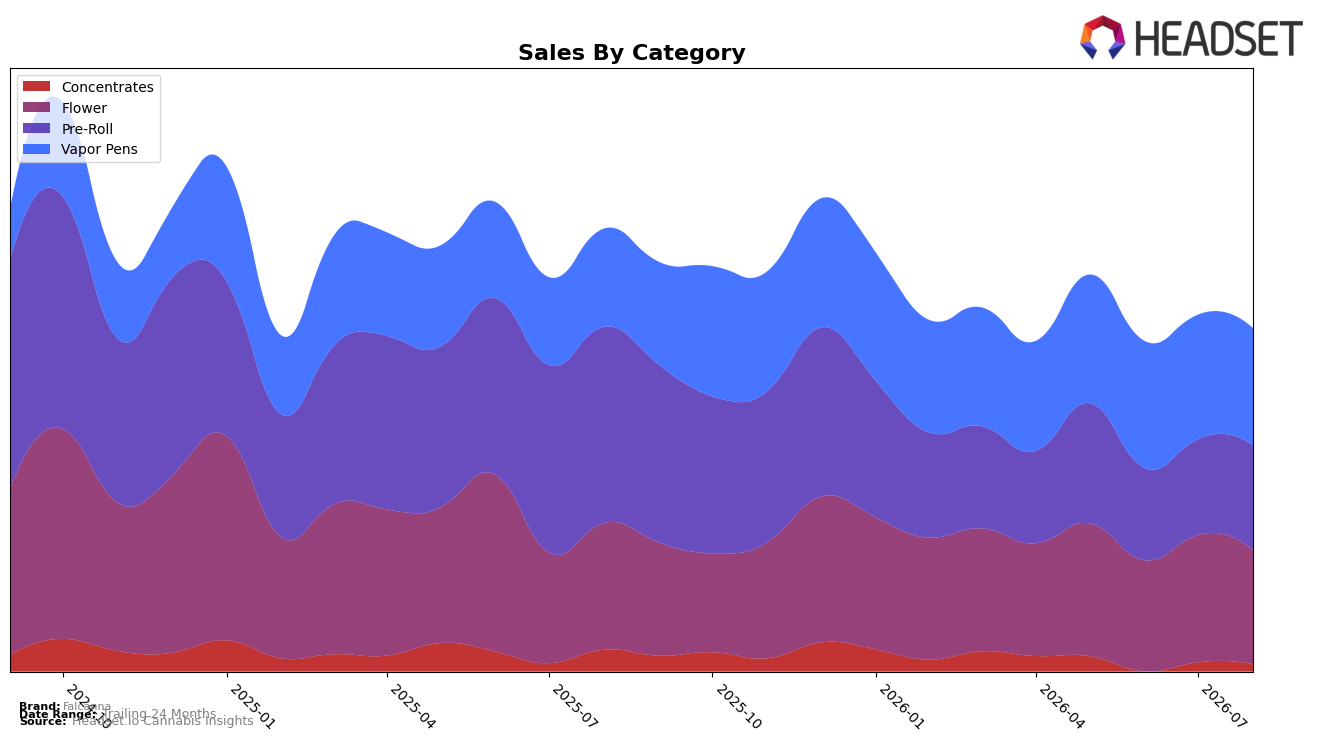
Falcanna’s mix in August 2026 tilted toward Vapor Pens at 30.64% share with a 12.51% YoY lift despite a 4.32% MoM dip, while Flower held 30.14% share with a 6.93% YoY decline and a 7.26% MoM pullback; Pre-Roll accounted for 28.43% share with a 36.81% YoY contraction but a 6.13% MoM rebound, and Concentrates at 10.79% share fell 19.59% YoY and 3.03% MoM. With the brand’s overall sales down 15.27% YoY and average prices up 3.76% YoY, the mix indicates a pivot toward higher-surviving Vapor Pens and away from contracting Pre-Roll, implying that margin preservation is being prioritized over volume recovery.
Holding rank 42 in Vapor Pens in Washington alongside a 12.51% YoY category gain and a 4.32% MoM slip suggests Falcanna is mid-pack but leveraged to the most durable part of its portfolio, while Flower’s 6.93% YoY and 7.26% MoM declines weigh on breadth. The 28.43% Pre-Roll share paired with a 36.81% YoY drop concentrates risk in a shrinking segment, whereas the 10.79% Concentrates share and 19.59% YoY decline limit upside, so the pattern points to a positioning that favors Vapor Pens scale over diversification, with August 2026 momentum hinging on stabilizing Flower while converting Pre-Roll’s 6.13% MoM uptick into sustained share defense.
Competitive Landscape
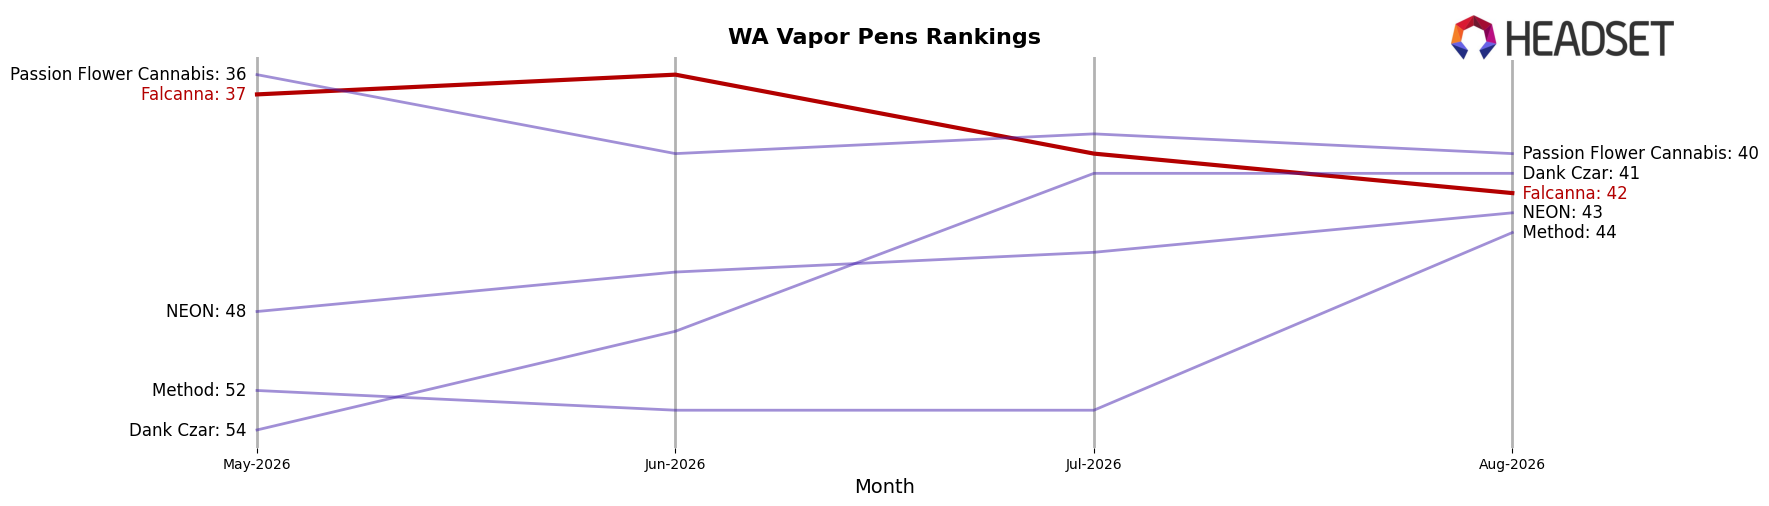
Falcanna sits at rank #42 in Washington Vapor Pens for August 2026, a 1-position improvement from #43 year over year but a 5-position drop from #37 in May 2026, and it remains 8 spots below its peak of #34 from October 2025. Competitive movement is tightening at the top: Crystal Clear climbed from #3 to #1 while growing sales 19.4% year over year, whereas Mfused fell from #1 to #2 with a 32.6% sales decline, indicating leadership churn that Falcanna has not translated into rank gains beyond the 1-place YoY shift. With peers like Plaid Jacket rising from #6 to #3 alongside a 15.5% sales increase, Falcanna’s slide from #37 to #42 across the last three months and its 8-rank gap to the October 2025 peak imply a drift toward the lower mid-pack unless recent share losses are reversed.
Notable Products
Pineapples In Space Pre-Roll 2-Pack (1.2g) posted the standout movement in August 2026 with a +73.7% month-over-month surge to rank 2, while Diesel Thai Pre-Roll 2-Pack (1.2g) fell -22.5% to rank 3, indicating shifting preference within Falcanna’s pre-roll lineup. Candy Queen Pre-Roll 2-Pack (1.2g) held rank 1 with +23.0% growth as pre-rolls occupied five of the top seven ranks, implying a concentrated demand spine in small-pack formats even as one SKU contracted. In vapor pens, Candy Queen Live Resin Cartridge (1g) was steady at rank 8 with +0.5% while Deep Sea Live Resin HTE Ceramic Cartridge (1g) and Pacific Purple Live Resin Cartridge (1g) slipped -8.6% and -9.0% at ranks 9 and 10, respectively, suggesting pens are a secondary but sizable basket with at least one SKU surpassing $13,000. The pattern implies Falcanna’s commercial direction is consolidating around a few performance-leading strain families across both pre-rolls and vapor pens, signaling resource allocation toward winning strains and pack sizes over broad SKU proliferation.
Top Selling Cannabis Brands






Data for this report comes from real-time sales reporting by participating cannabis retailers via their point-of-sale systems, which are linked up with Headset’s business intelligence software. Headset’s data is very reliable, as it comes digitally direct from our partner retailers. However, the potential does exist for misreporting in the instance of duplicates, incorrectly classified products, inaccurate entry of products into point-of-sale systems, or even simple human error at the point of purchase. Thus, there is a slight margin of error to consider. Brands listed on this page are ranked in the top twenty within the market and product category by total retail sales volume.

