.svg)

Aug-2026
Sales
Trend
6-Month
Product Count
SKUs
Avg Price
YoY Sales Change
YoY Price Change


Where to Buy
nuEra is stocked at 54 licensed dispensaries across Illinois, with the deepest coverage in Chicago, Addison, Bourbonnais, Champaign, and Plainfield. Search by ZIP code or city below to find the closest one, or filter by product type if you are after a specific format.
Market Insights Snapshot
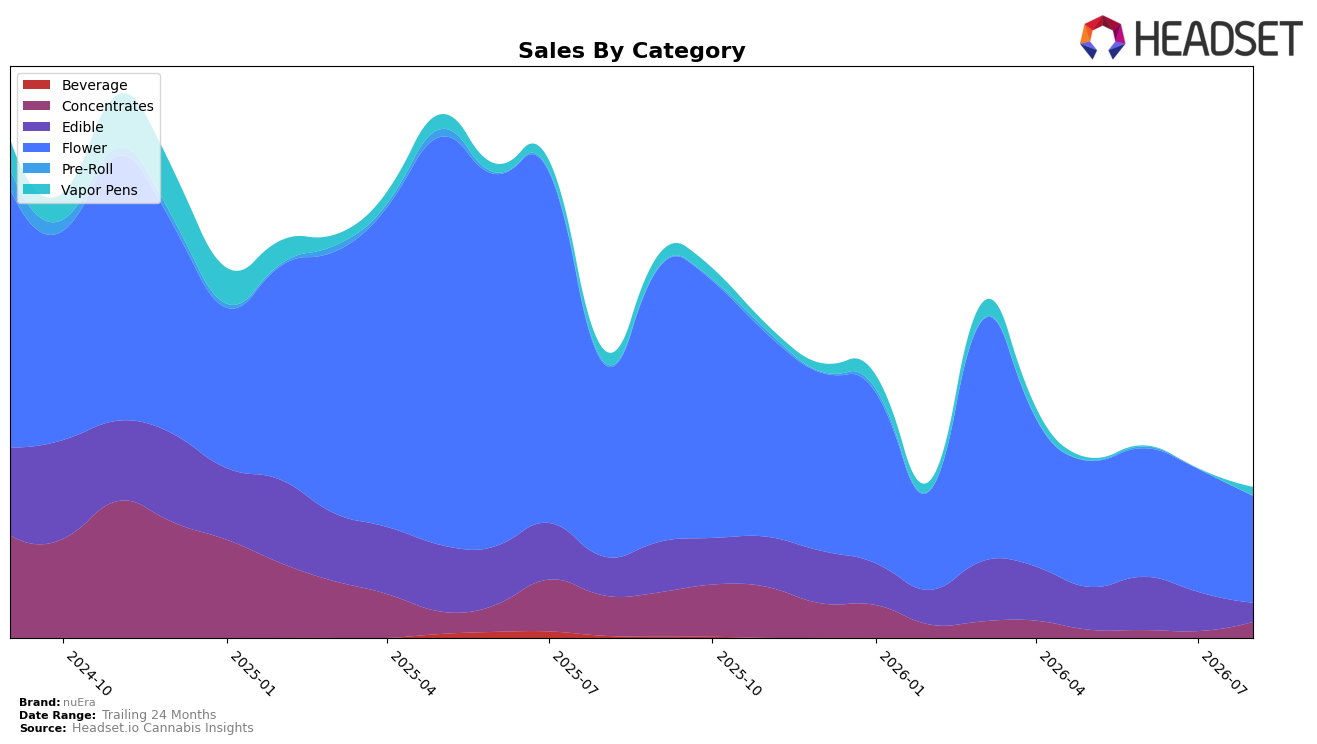
In August 2026, nuEra’s mix concentrated further into Flower at 71.36% share, even as Flower sales declined 44.68% year over year and 13.20% month over month; Edible retreated to 12.66% share with a 51.05% YoY drop and a 51.48% MoM contraction. By contrast, Concentrates rose to 10.51% share on a 141.92% MoM surge despite a 60.77% YoY decline, while Vapor Pens held 5.47% share with a 32.09% YoY decrease and an unreported MoM figure; within Illinois Flower, nuEra sat at rank 50, indicating category pressure despite the mix tilt. The pattern implies a pivot under strain: reliance on Flower amid double‑digit MoM decline and rank 50 positioning risks further share erosion, while a sharp MoM rebound in Concentrates offers a nearer‑term lever to stabilize mix if sustained.
Price and positioning signals point to value recalibration and assortment compression: the brand’s average price fell 9.95% YoY alongside a 47.96% YoY sales decline, while Flower’s average price at $38.62 sits above Vapor Pens at $27.63 and Edible at $18.53, with Concentrates at $30.13 pairing a lower ticket with a 141.92% MoM volume‑driven lift. With 24‑month sales down 74.41% and Flower still 71.36% of the mix as rank 50 in Illinois, the implication is that nuEra’s positioning is over‑indexed to a weakening anchor category and should reweight toward Concentrates’ momentum while defending Edible losses, using the lower average price tiers to rebuild traffic without sacrificing category breadth.
Competitive Landscape
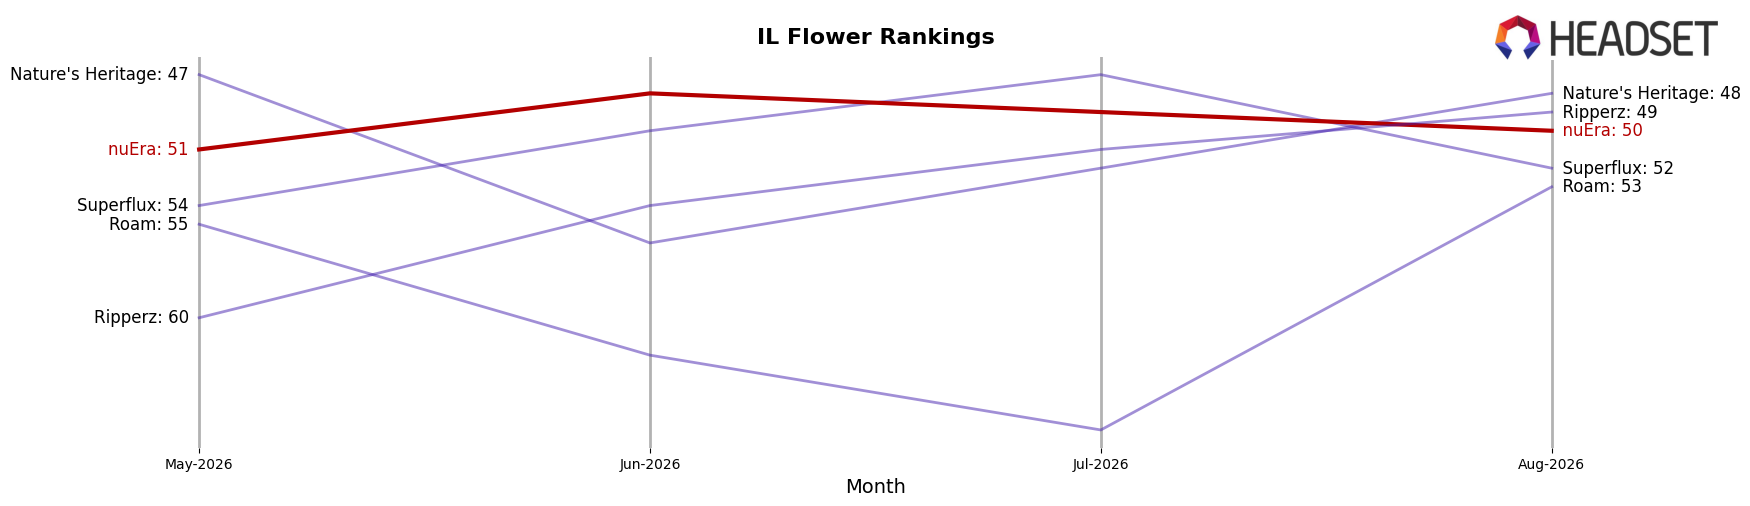
nuEra sits at rank #50 in Illinois Flower for August 2026, sliding 12 spots year over year from #38 while edging up 1 place from #51 over the last three months; by contrast, High Supply / Supply held at #1 year over year despite a 10.1% YoY sales decline, and The Botanist surged from #29 to #4 alongside a 482.1% YoY sales increase. nuEra’s current #50 also trails its historical peak of #26 from May 2025, while RYTHM maintained #2 year over year with 36.5% YoY sales growth; this widening gap versus leaders who are stable or advancing implies nuEra’s rank trajectory is drifting toward the long tail unless assortment or pricing resets reverse the downward YoY position.
Notable Products
Pink Lemonade Live Resin Gummies 10-Pack (100mg) posted the steepest movement in August 2026 with a -65.8% month-over-month change and slid to rank 8, while Green Apple Live Resin Gummies 10-Pack (100mg) fell -21.0% yet held rank 1. In contrast, Black Inferno (7g) rose +46.5% month over month to rank 3, and Black Inferno (3.5g) eased -8.6% at rank 4. With five of the top ten SKUs in Flower, the shift suggests nuEra is rotating shelf energy toward inhalables as edibles lose velocity.
Top Selling Cannabis Brands






Data for this report comes from real-time sales reporting by participating cannabis retailers via their point-of-sale systems, which are linked up with Headset’s business intelligence software. Headset’s data is very reliable, as it comes digitally direct from our partner retailers. However, the potential does exist for misreporting in the instance of duplicates, incorrectly classified products, inaccurate entry of products into point-of-sale systems, or even simple human error at the point of purchase. Thus, there is a slight margin of error to consider. Brands listed on this page are ranked in the top twenty within the market and product category by total retail sales volume.

