Dec-2025
Sales
Trend
6-Month
Product Count
SKUs
Overview
Market Insights Snapshot
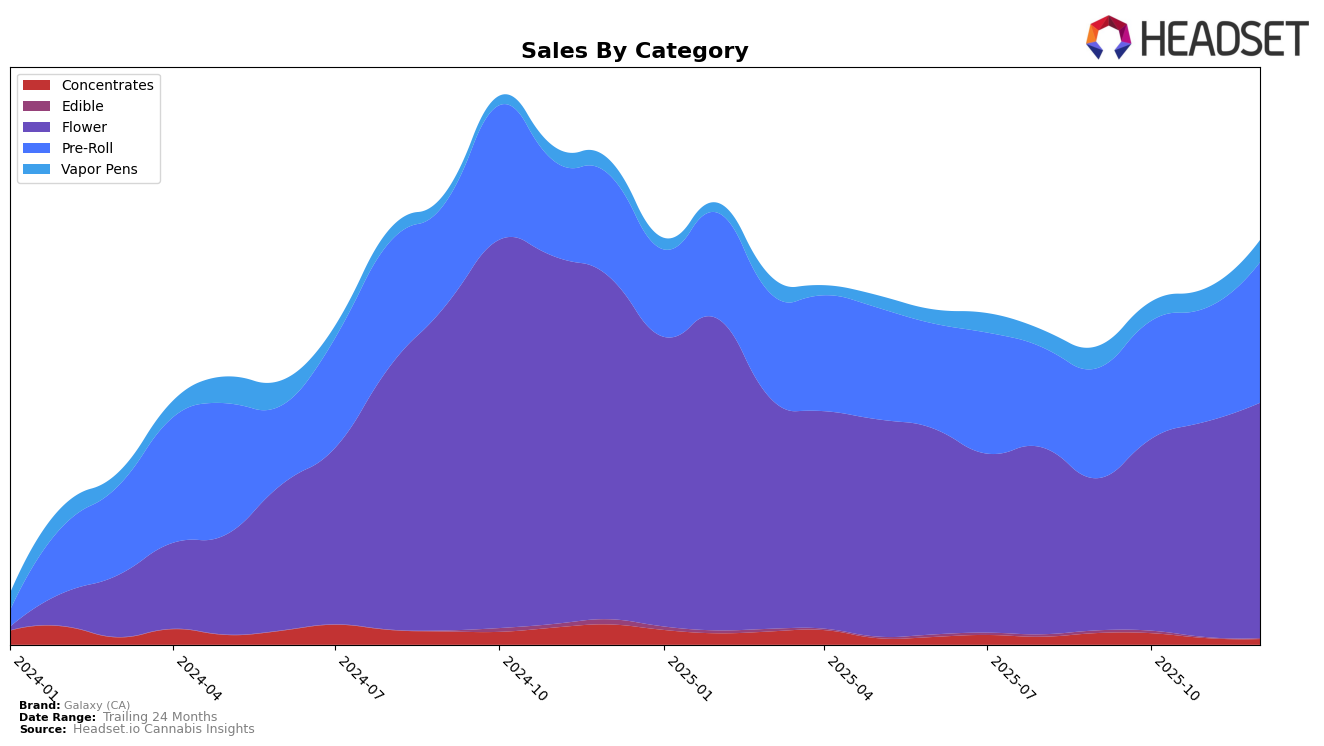
Galaxy (CA) has shown varied performance across different product categories and states. In California, the brand's presence in the concentrates category has been relatively weak, as it failed to secure a position within the top 30 brands from September to December 2025. This suggests a challenging competitive landscape in California's concentrates market. However, the brand's performance in the pre-roll category is noteworthy, as it climbed from the 65th position in September to the 47th by December. This upward trajectory indicates a growing consumer preference or improved market strategy for Galaxy's pre-roll products in California.
In Illinois, Galaxy (CA) has demonstrated a more robust foothold, particularly in the flower category. The brand improved its rank from 33rd in September to 26th by December, reflecting a consistent increase in sales and possibly an expanding market share. Meanwhile, in the pre-roll category, Galaxy managed to stay within the top 35 brands, peaking at the 29th position in December. This stability in Illinois's pre-roll market suggests a steady consumer base or effective distribution channels for Galaxy's products in the state. Overall, Galaxy's performance across these states highlights both challenges and opportunities, with notable gains in some areas and room for growth in others.
Competitive Landscape
In the competitive landscape of the Flower category in Illinois, Galaxy (CA) has shown a notable upward trajectory in its rankings from September to December 2025. Starting outside the top 20 in September, Galaxy (CA) climbed to the 26th position by December, indicating a consistent improvement in market presence. This upward trend is contrasted by Legacy Cannabis (IL), which experienced a decline in rank from 18th to 25th over the same period, suggesting a potential opportunity for Galaxy (CA) to capture market share from competitors facing challenges. Meanwhile, Paul Bunyan and Bedford Grow maintained relatively stable positions, indicating a steady performance. Notably, Elevate demonstrated significant growth, moving from 48th to 28th place, which highlights the dynamic nature of the market. Galaxy (CA)'s consistent sales growth, coupled with its improved ranking, positions it as a brand to watch in the evolving Illinois Flower market.

Notable Products
In December 2025, Galaxy (CA) saw Cap Junky Pre-Roll 10-Pack (5g) rise to the top, achieving the number one rank with notable sales of 896 units. Cap Junky (3.5g) maintained its strong performance, holding steady at the second position for two consecutive months with December sales reaching 869 units. Cap Junky (7g) climbed from fourth to third place, showing a positive trend in sales. Subzero #12 (7g) entered the rankings for the first time in December, securing the fourth spot. Garlic Cocktail #7 (14g) dropped to fifth place, indicating a decline in sales momentum compared to previous months.
Top Selling Cannabis Brands
Data for this report comes from real-time sales reporting by participating cannabis retailers via their point-of-sale systems, which are linked up with Headset’s business intelligence software. Headset’s data is very reliable, as it comes digitally direct from our partner retailers. However, the potential does exist for misreporting in the instance of duplicates, incorrectly classified products, inaccurate entry of products into point-of-sale systems, or even simple human error at the point of purchase. Thus, there is a slight margin of error to consider. Brands listed on this page are ranked in the top twenty within the market and product category by total retail sales volume.


