.svg)

Sep-2026
Sales
Trend
6-Month
Product Count
SKUs
Avg Price
YoY Sales Change
YoY Price Change


Where to Buy
Good Good (MI) is stocked at 157 licensed dispensaries across Michigan, with the deepest coverage in New Buffalo, Detroit, Monroe, Battle Creek, and Center Line. Search by ZIP code or city below to find the closest one, or filter by product type if you are after a specific format.
Market Insights Snapshot
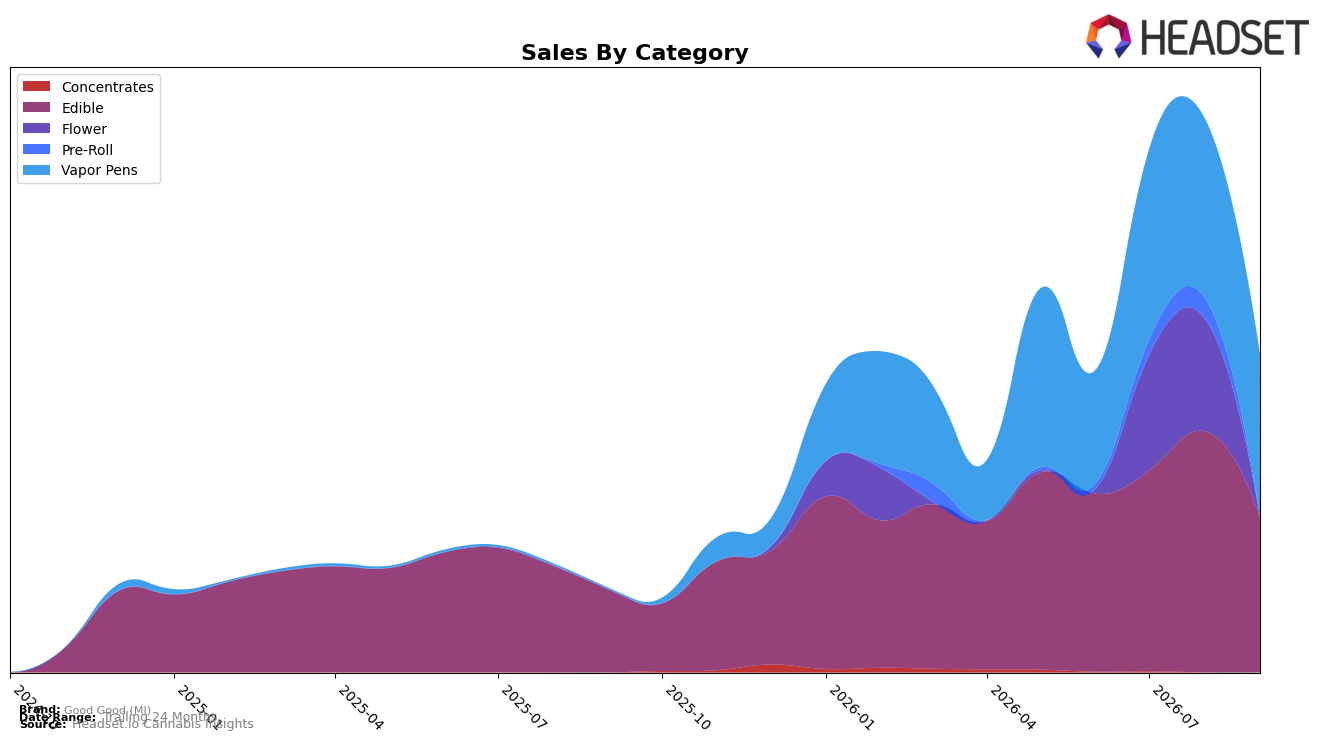
Good Good (MI) split its September 2026 revenue almost evenly between Vapor Pens at 51.16% share and Edible at 48.71% share, but the trajectories diverged: Vapor Pens posted a 14,749.67% year-over-year change alongside a month-over-month decline of 9.43%, while Edible rose 86.81% year-over-year but fell 35.78% month-over-month. Minor lines collapsed month-over-month, with Pre-Roll down 98.59% and Flower down 99.87%, leaving category concentration tighter even as brand-level sales grew 278.55% year-over-year; the average price increased 92.62% year-over-year to $3.23, contrasting with a Vapor Pens average of $11.53 and Edible at $1.84. The pattern implies a two-pillar model where Edible volume sustains scale at a low unit price while Vapor Pens carries higher ticket size, and the steep month-over-month pullback across three categories signals a sensitivity to short-cycle demand that could reshape mix in October 2026.
The mix shift, with Vapor Pens at 51.16% share and ranked 40 in Michigan Vapor Pens, suggests that September 2026 gains were breadth-light but price-levered: a 92.62% brand-level average price increase against a 9.43% month-over-month decline in Vapor Pens and a 35.78% drop in Edible positions the brand to trade up in fewer baskets while risking velocity loss. With Edible still 48.71% of sales and up 86.81% year-over-year, the brand retains a volume ballast, but the near-wipeout of Pre-Roll (down 98.59% month-over-month) and Flower (down 99.87% month-over-month) removes cross-category entry points that typically feed trial; this implies the brand’s positioning is narrowing toward price-tiered pen and edible propositions, with rank 40 indicating headroom that likely depends on stabilizing month-over-month swings rather than pushing into micro-scale categories.
Competitive Landscape
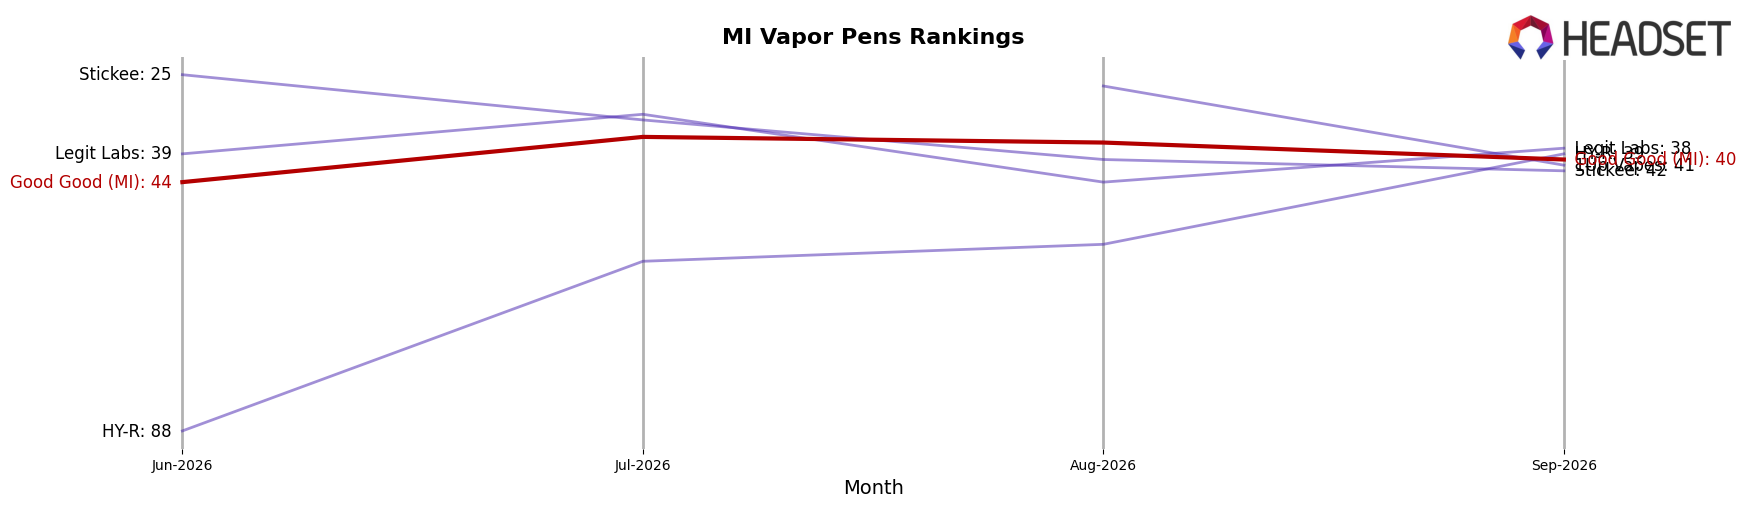
Good Good (MI) sits at rank #40 in September 2026 after climbing 184 places from #224 year over year, while improving 4 spots from #44 in June 2026 and coming off a peak of #36 in July 2026; by contrast, MKX Oil Company advanced to #1 from #3 with a 21.7% YoY sales increase and Society C surged to #4 from #12 alongside a 276.2% YoY sales gain, indicating that Good Good (MI)’s upward rank trajectory is outpaced by faster-moving leaders and implies a fight to convert mid-tier momentum into sustained top-30 presence.
Notable Products
Sour Wild Berries Gummies 4-Pack (200mg) delivered the steepest contraction in September 2026 at -57.4% MoM while sitting at rank 9, and Pomegranate Passion Gummies 4-Pack (200mg) also fell -52.5% MoM at rank 7, signaling deep pullback in mid-tier SKUs. At the top, Blue Raspberry Splash Gummies 4-Pack (200mg) held rank 1 despite a -23.9% MoM decline, while Peach Mango Wave Gummies 4-Pack (200mg) at rank 2 matched a -23.9% MoM slide, whereas Fruit Punch Gummies 4-Pack (200mg) in rank 3 was the lone mover up at +1.6% MoM. Four of the top ten are sour-leaning or tart-positioned gummies that collectively posted declines between -43.2% and -57.4%, and Strawberry Lemonade Gummies 4-Pack (200mg) at rank 4 also dipped -10.9% MoM alongside Grape Power Gummies 4-Pack (200mg) at -41.0% MoM, implying a flavor reset is underway with demand consolidating around fewer, non-sour core profiles.
Top Selling Cannabis Brands






Data for this report comes from real-time sales reporting by participating cannabis retailers via their point-of-sale systems, which are linked up with Headset’s business intelligence software. Headset’s data is very reliable, as it comes digitally direct from our partner retailers. However, the potential does exist for misreporting in the instance of duplicates, incorrectly classified products, inaccurate entry of products into point-of-sale systems, or even simple human error at the point of purchase. Thus, there is a slight margin of error to consider. Brands listed on this page are ranked in the top twenty within the market and product category by total retail sales volume.

