.svg)

Aug-2026
Sales
Trend
6-Month
Product Count
SKUs
Avg Price
YoY Sales Change
YoY Price Change


Where to Buy
Goodies (WA) is stocked at 134 licensed dispensaries across New Jersey, Michigan, and 3 other states, 82 of them in New Jersey, with the deepest coverage in Hoboken, Trenton, Atlantic City, Mount Holly, and Newton. Search by ZIP code or city below to find the closest one, or filter by product type if you are after a specific format.
Market Insights Snapshot
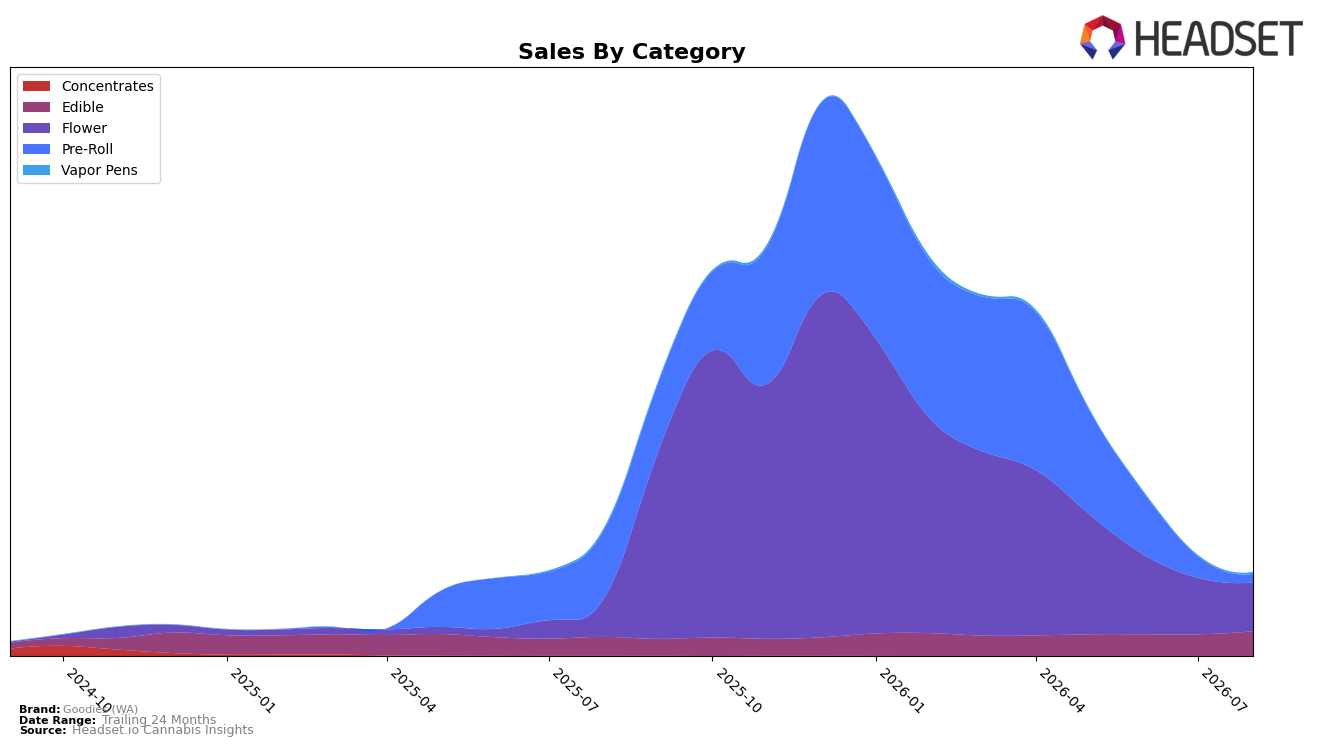
In August 2026, Goodies (WA) concentrated 58.53% of sales in Flower with a 26.30% year-over-year increase but a -13.60% month-over-month decline, while Edible held 29.43% share with 30.98% YoY growth and a 14.36% MoM gain. Pre-Roll contracted to 9.96% share with -87.89% YoY and -61.36% MoM, and Vapor Pens remained a small 2.08% share despite a 70.25% MoM jump and a -10.43% YoY dip. Average price rose 56.27% YoY to $17.91, contrasting with the brand’s -34.85% YoY sales change, and within categories Flower’s average price at 39.77 and Edible at 8.46 indicate a widening price barbell. The mix signals a pivot toward higher-priced Flower and resilient Edible volume as Pre-Roll retrenches, implying margin exposure to Flower’s MoM softness alongside a stabilizing base in Edible.
Goodies (WA)’s position in Flower at rank 86 in New Jersey underscores reliance on a category where the brand shows +26.30% YoY but -13.60% MoM, while Edible’s +30.98% YoY and +14.36% MoM trajectory provides a counterweight to category cyclicality. The steep Pre-Roll pullback of -61.36% MoM and -87.89% YoY removes a low-ticket velocity driver just as average price climbs 56.27% YoY, and Vapor Pens’ 70.25% MoM rebound from a 2.08% share base limits immediate impact. Together, these shifts imply the brand is trading into a higher-price, lower-frequency stance anchored by Flower, with Edible acting as the continuity category to buffer monthly volatility and support sustained basket penetration.
Competitive Landscape
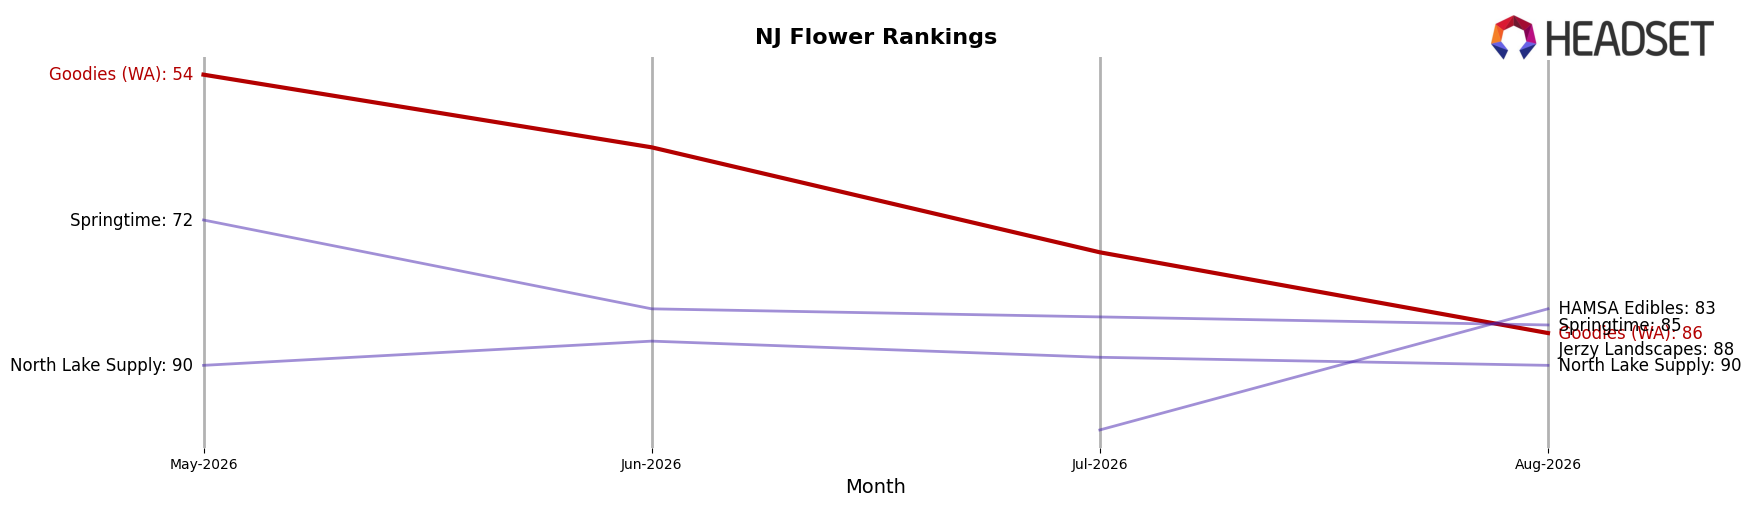
Goodies (WA) ranks #86 in New Jersey Flower in August 2026, sliding 15 positions year over year from #71 and down 32 spots since May 2026 when it stood at #54, while its best historical mark of #28 in December 2025 underscores how far the brand has retrenched; against the current leaders, Ozone sits at #1 after improving from #2 despite a -18.5% sales YoY change, and Find. climbed from #5 to #2 with +40.5% sales YoY, indicating that Goodies (WA) is losing rank share to competitors that are either improving position despite contraction or translating growth into rank gains, implying the brand’s trajectory points to eroding placement relevance unless it reverses multi-period slippage.
Notable Products
Caramel Apple Donut Infused Pre-Roll (1g) posted the steepest movement in August 2026 with a -58% month-over-month decline and slipped to rank 5, signaling a sharp pullback in Pre-Rolls versus Edibles and Flower. CBN:THC 2:1 Sour Berry Punch Gummies 10-Pack (100mg THC, 50mg CBN) rose 11% MoM and held rank 1, while Black Maple 22 (7g) fell 41% MoM at rank 7, indicating bifurcation between value-driving functional gummies and volatile Flower and Pre-Roll SKUs. With four of the top ten coming from Edibles and Animal Tsunami (7g) advancing 12% MoM at rank 4 against a $20,968 anchor from the top gummy, the mix points to concentration in cannabinoid-formulated gummies as the dependable volume engine. The pattern implies Goodies (WA) is tilting commercial focus toward functional Edibles while trimming exposure to underperforming Pre-Roll experiments.
Top Selling Cannabis Brands






Data for this report comes from real-time sales reporting by participating cannabis retailers via their point-of-sale systems, which are linked up with Headset’s business intelligence software. Headset’s data is very reliable, as it comes digitally direct from our partner retailers. However, the potential does exist for misreporting in the instance of duplicates, incorrectly classified products, inaccurate entry of products into point-of-sale systems, or even simple human error at the point of purchase. Thus, there is a slight margin of error to consider. Brands listed on this page are ranked in the top twenty within the market and product category by total retail sales volume.

