Jun-2026
Sales
Trend
6-Month
Product Count
SKUs
Avg Price
YoY Sales Change
YoY Price Change
Market Insights Snapshot
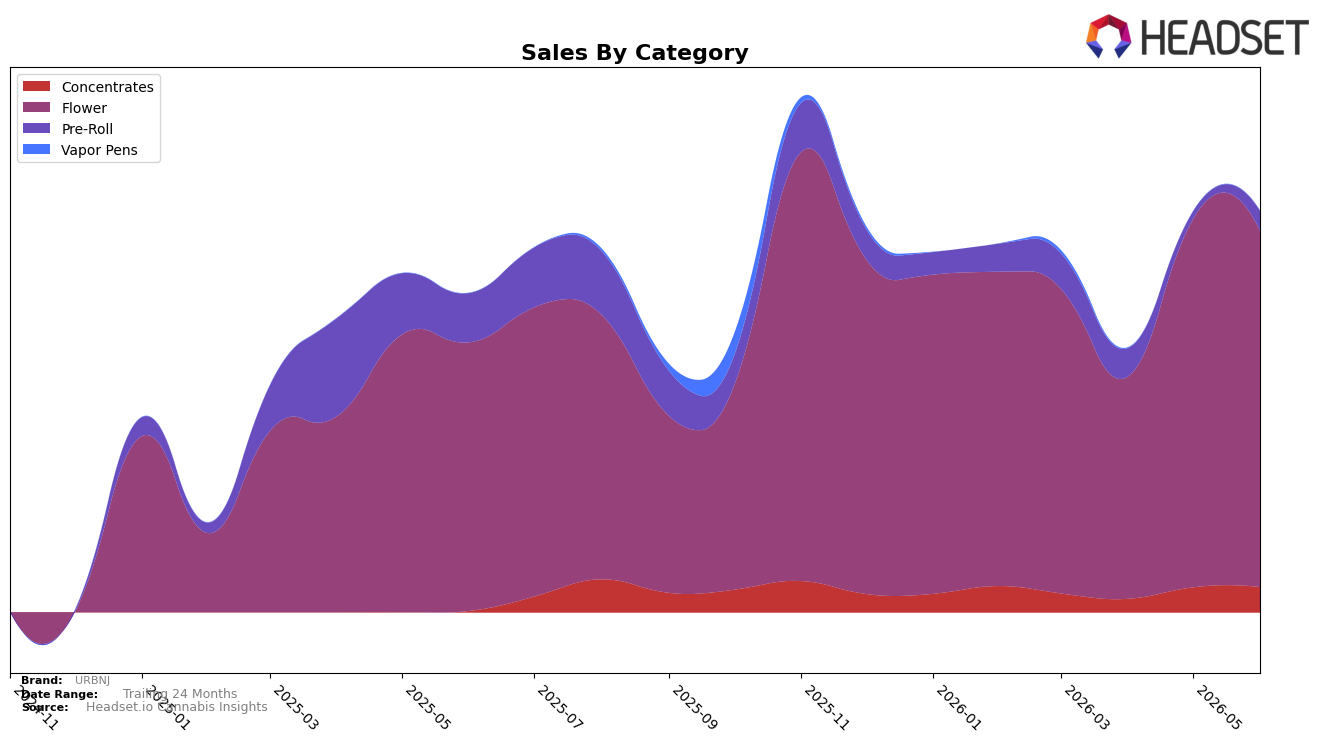
URBNJ’s June 2026 mix is concentrated in Flower at 88.82% share with a 32.69% year-over-year increase but a 3.15% month-over-month dip, while Concentrates expanded to 6.29% share on a 1,798.82% year-over-year surge and a 1.26% month-over-month lift; Pre-Roll holds 4.89% share with a 59.90% year-over-year decline offset by a 163.68% month-over-month rebound. Average price rose 163.37% year over year to $64.94, with Flower averaging $75.71 and Concentrates at $57.31, implying a trading-up effect even as overall brand sales rose 25.83% year over year; in New Jersey Flower ranks 34, indicating scale in the core category but with recent intra-category pressure.
The mix shift implies URBNJ is leaning into higher-ticket Flower while incubating Concentrates as a secondary growth engine, as evidenced by Concentrates’ 1,798.82% year-over-year growth against Flower’s 32.69% and Pre-Roll’s 59.90% year-over-year contraction; the 163.68% month-over-month Pre-Roll rebound alongside a 3.15% Flower month-over-month decline suggests promotional or portfolio rotation rather than a structural pivot. With 88.82% of sales tied to Flower and a 34th rank in New Jersey Flower, the path to share gains likely depends on sustaining premium price realization (163.37% year-over-year price increase) while broadening Concentrates’ 6.29% share to reduce volatility from category-specific softness.
Competitive Landscape
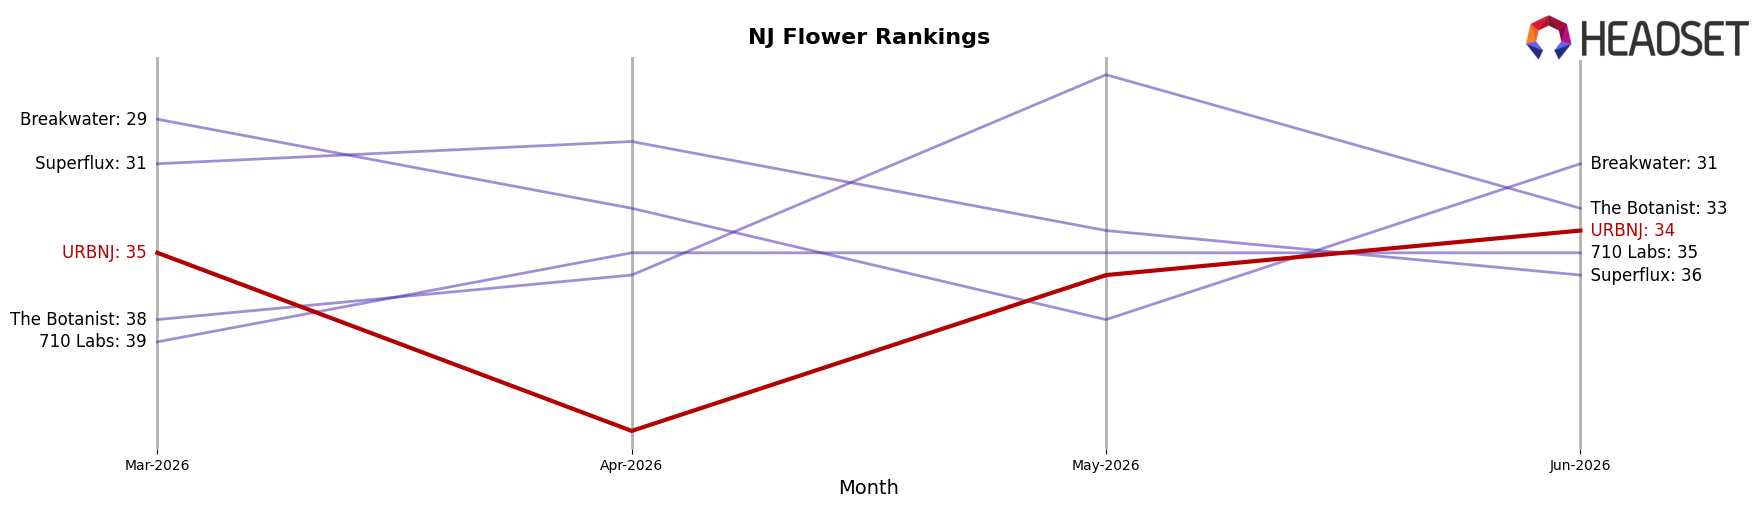
URBNJ sits at rank #34 in NJ Flower in June 2026, improving 1 position YoY from #35 and holding steady versus three months ago at #35, while its peak was #33 in November 2025; by contrast, Find. climbed from #12 to #1 with 225.99% YoY sales growth and Good Green advanced from #11 to #3 alongside 88.63% YoY growth, indicating that the competitive set is not just moving up the table but accelerating away from mid-30s brands. With Ozone holding #2 despite a -10.61% YoY sales decline and Simply Herb jumping from #9 to #4 on 57.93% growth, the mix of upward mobility at the top and stagnation near #34 suggests that URBNJ’s marginal rank gain is being outpaced by rivals consolidating share at the front of the pack; the trajectory implies URBNJ risks entrenchment in the low-30s unless it converts stability into multi-rank advances.
Notable Products
Animal Cookies x Wedding Cake Smalls (28g) set the tone in June 2026 with a month-over-month gain of 51.8% and a rank of 1, while no other top-10 SKU posted a disclosed MoM change and the next-best ranks sat at 2 and 3. Flower concentrates within the top ten, with five Flower entries occupying ranks 1, 3, 4, 7, and 8, indicating category concentration alongside a lone Pre-Roll at rank 2 and Concentrates at ranks 6 and 9. The top Flower SKU’s sales reached $46,825 at rank 1 versus Pre-Rolls clustered at ranks 2 and 5, suggesting premium large-format Flower is pulling share from value Pre-Rolls. Together this pattern implies URBNJ is consolidating around high-velocity Flower formats as the commercial center of gravity, with Pre-Roll and Concentrates playing supporting roles rather than volume leaders.
Top Selling Cannabis Brands
Data for this report comes from real-time sales reporting by participating cannabis retailers via their point-of-sale systems, which are linked up with Headset’s business intelligence software. Headset’s data is very reliable, as it comes digitally direct from our partner retailers. However, the potential does exist for misreporting in the instance of duplicates, incorrectly classified products, inaccurate entry of products into point-of-sale systems, or even simple human error at the point of purchase. Thus, there is a slight margin of error to consider. Brands listed on this page are ranked in the top twenty within the market and product category by total retail sales volume.

