Jun-2026
Sales
Trend
6-Month
Product Count
SKUs
Avg Price
YoY Sales Change
YoY Price Change
Market Insights Snapshot
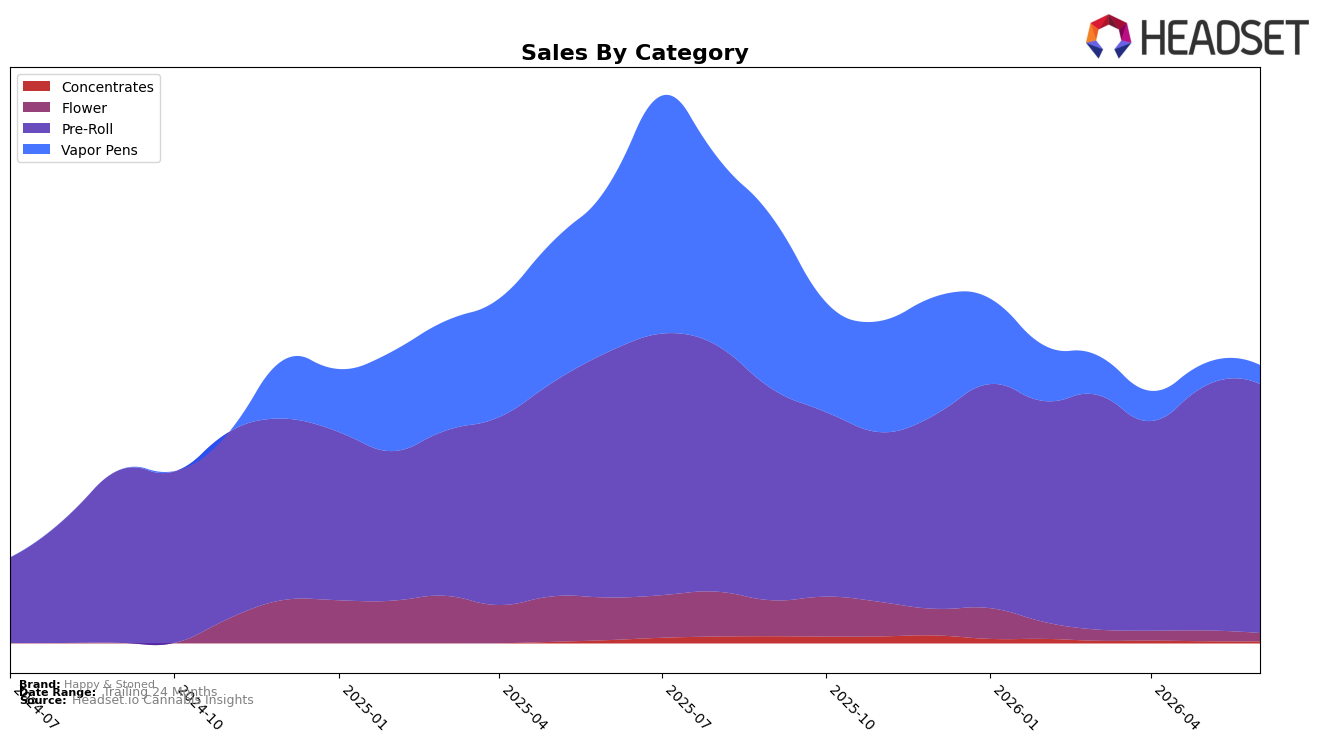
In June 2026, Happy & Stoned concentrated 89.63% of sales in Pre-Roll, where category sales were up 1.39% year over year and 1.95% month over month, while Vapor Pens fell 88.69% YoY and 16.93% MoM to 6.77% share. Flower contracted 80.80% YoY and 22.76% MoM to 2.93% share, and Concentrates declined 41.15% YoY and 8.04% MoM to 0.67% share; alongside this mix shift, the brand’s average price dropped 45.21% YoY as overall brand sales were down 39.28% YoY. With Pre-Roll now dominant and stabilizing versus double‑digit contractions elsewhere, the pattern implies the brand is leaning into a value-led Pre-Roll strategy that is cushioning broader declines and concentrating demand in a single growth pocket.
Positioning-wise, a 1.95% MoM lift in Pre-Roll coupled with an 88.69% YoY retreat in Vapor Pens and an 80.80% YoY slide in Flower indicates the brand is trading assortment breadth for depth, likely prioritizing lower ticket Pre-Roll as the price mix resets. Holding rank 29 in Pre-Roll in Ontario while consolidating 89.63% of volume into that category suggests a scale-first play: defend a mid-pack slot by using lower average prices to sustain throughput, even as higher-priced categories like Vapor Pens (-16.93% MoM) and Flower (-22.76% MoM) shrink, which implies near-term share defense in Pre-Roll at the expense of premium-category relevance.
Competitive Landscape
Happy & Stoned sits at rank #29 in ON Pre-Roll for June 2026, unchanged from #29 year over year and up 2 positions from #31 in March 2026, while its best historical mark was #26 in July 2025; meanwhile, Back Forty / Back 40 Cannabis climbed from #3 to #1 with a 74.6% YoY sales change as General Admission slipped from #1 to #2 on a -17.9% YoY decline, and Jeeter fell from #2 to #4 with -48.5% YoY, indicating that despite competitor volatility at the top, a flat #29 YoY rank alongside a 2-rank improvement since March 2026 points to a stable but capped position that will require step-change gains to re-approach the #26 peak.

Notable Products
Quick Rips Indica Pre-Roll 4-Pack (2g) set the tone with a -17.6% month-over-month drop while holding rank 2, contrasting with Quick Rips Sativa Pre-Roll 4-Pack (2g) up 3.2% at rank 1. Joyride Pre-Roll (1g) climbed 15.9% at rank 3 as Aloha White Widow Pre-Roll 4-Pack (2g) rose 19.0% at rank 4, and five multi-pack SKUs occupy ranks 1, 2, 4, 5, and 10, indicating concentration in value-oriented packs. The pattern implies reliance on multi-pack dominance to offset volatility in single strains and to preserve share at the top of the lineup.
Top Selling Cannabis Brands
Data for this report comes from real-time sales reporting by participating cannabis retailers via their point-of-sale systems, which are linked up with Headset’s business intelligence software. Headset’s data is very reliable, as it comes digitally direct from our partner retailers. However, the potential does exist for misreporting in the instance of duplicates, incorrectly classified products, inaccurate entry of products into point-of-sale systems, or even simple human error at the point of purchase. Thus, there is a slight margin of error to consider. Brands listed on this page are ranked in the top twenty within the market and product category by total retail sales volume.

