.svg)

Sep-2026
Sales
Trend
6-Month
Product Count
SKUs
Avg Price
YoY Sales Change
YoY Price Change


Where to Buy
Head Change is stocked at 158 licensed dispensaries across Missouri, with the deepest coverage in Kansas City, St. Louis, Springfield, Columbia, and Cape Girardeau. Search by ZIP code or city below to find the closest one, or filter by product type if you are after a specific format.
Market Insights Snapshot
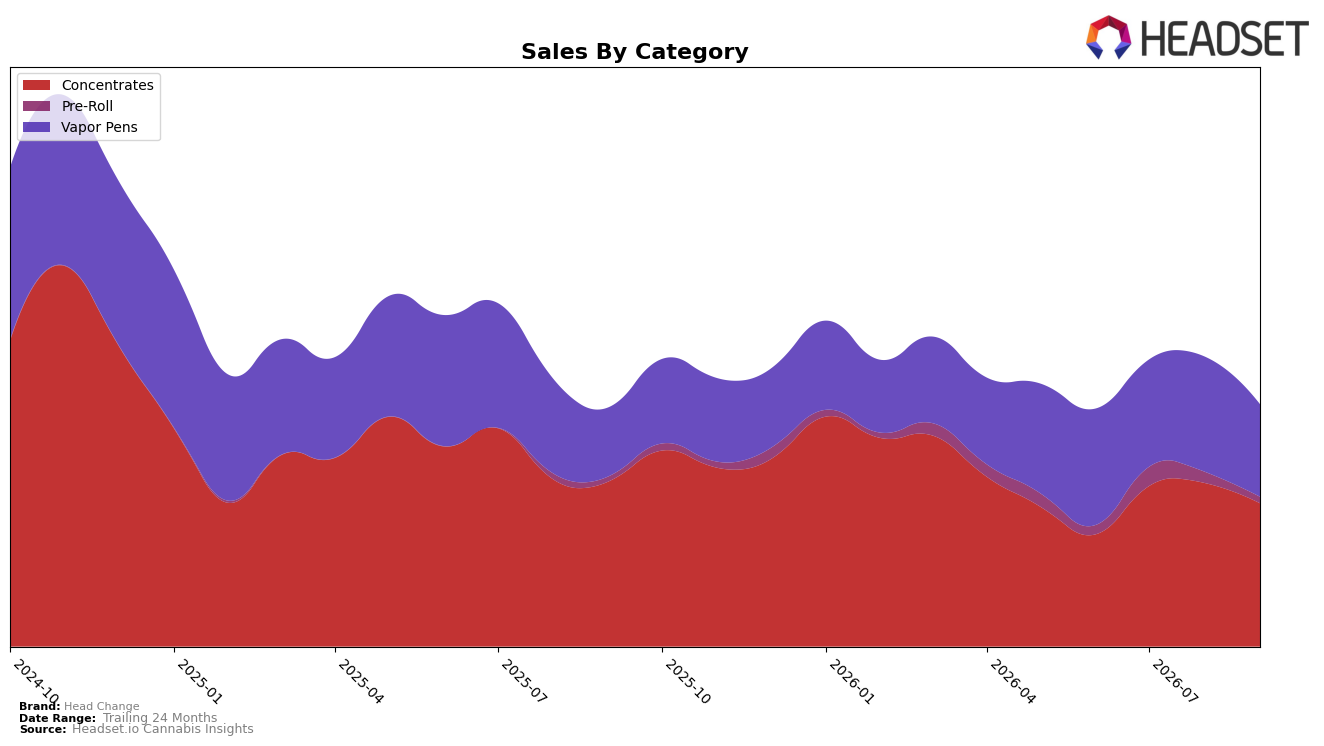
Head Change concentrated its September 2026 mix in Concentrates at 59.24% share (ranked 4th in Concentrates in Missouri), while Vapor Pens held 38.20% and Pre-Roll 2.55%. Year over year, Concentrates declined 13.15% and Vapor Pens increased 34.20%, whereas month over month both Concentrates and Vapor Pens fell 12.43% and 19.69%, respectively; Pre-Roll rose 28.84% YoY but dropped 43.46% MoM. With overall brand sales up 1.36% YoY but down 42.88% over 24 months and average price down 22.91% YoY to $40.38, the pattern implies the brand is using price to protect volume while a Concentrates-heavy mix is amplifying short-term volatility.
The shift toward Vapor Pens growing 34.20% YoY alongside a 13.15% YoY slide in Concentrates, yet simultaneous MoM declines of 19.69% and 12.43%, indicates Head Change is overexposed to categories that swing with promo cadence and seasonal demand. Holding a 59.24% stake in Concentrates while ranking 4th in Missouri suggests headroom to rebalance toward Vapor Pens to smooth MoM swings, but the 43.46% MoM drop in Pre-Roll despite a 28.84% YoY gain signals that incremental categories are not yet stabilizing share. The implication is to shift mix weight from Concentrates by a few share points toward Vapor Pens to leverage the YoY tailwind while tightening price architecture, since a 22.91% YoY price reduction has not prevented MoM contractions across all three categories.
Competitive Landscape
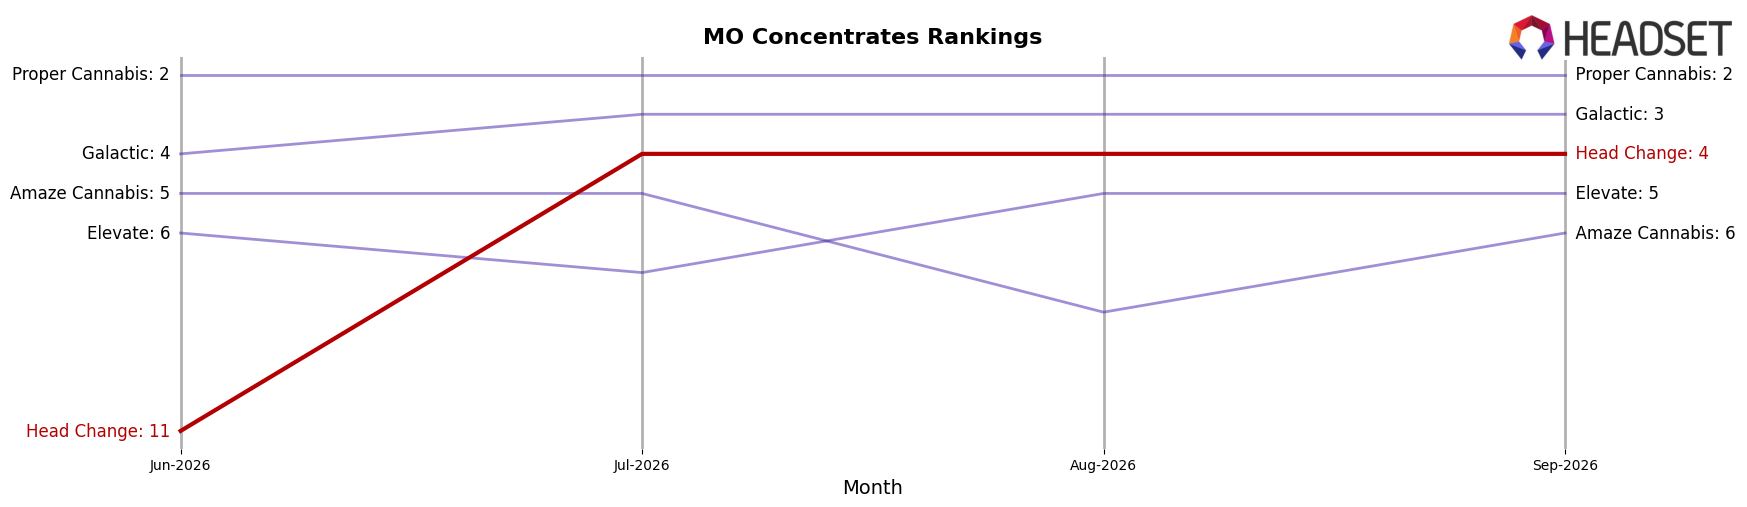
Head Change is ranked #4 in Missouri Concentrates in September 2026, improving 2 positions from #6 year over year and jumping 7 positions from #11 in June 2026, while still below its #1 peak from November 2024; by comparison, Vibe Cannabis (MO) held at #1 with 0 rank change and year-over-year sales up 20.7%, and Elevate fell from #2 to #5 amid a 41.8% sales decline, indicating Head Change is regaining share against a weakening mid-pack and a stable leader, implying its rank trajectory points to competitive re-entry into the top three if recent quarterly momentum persists.
Notable Products
The steepest movement in September 2026 was Diesel Dojo Live Resin Badder (1g), which fell 42.9% MoM while holding rank 3, indicating demand pressure in Concentrates even as it remains a top seller. Fresh Produce #33 Live Sauce Cartridge (0.5g) slid 9.0% MoM at rank 4, and Vapor Pens occupied six of the top ten positions, concentrating over half the leaderboard in a single category. Within Vapor Pens, rank positions clustered tightly at 1, 2, 4, 5, 6, and 8, while the sole outsized MoM move was negative in Concentrates, implying Head Change is tilting commercial focus toward pen formats and away from live badder despite $8.3k posted by Too Much Starburst Live Resin Sauce Cartridge (0.5g).
Top Selling Cannabis Brands






Data for this report comes from real-time sales reporting by participating cannabis retailers via their point-of-sale systems, which are linked up with Headset’s business intelligence software. Headset’s data is very reliable, as it comes digitally direct from our partner retailers. However, the potential does exist for misreporting in the instance of duplicates, incorrectly classified products, inaccurate entry of products into point-of-sale systems, or even simple human error at the point of purchase. Thus, there is a slight margin of error to consider. Brands listed on this page are ranked in the top twenty within the market and product category by total retail sales volume.

