.svg)

Aug-2026
Sales
Trend
6-Month
Product Count
SKUs
Avg Price
YoY Sales Change
YoY Price Change


Where to Buy
Hijinks is stocked at 119 licensed dispensaries across Pennsylvania, Ohio, and 2 other states, 37 of them in Pennsylvania, with the deepest coverage in Pittsburgh, Philadelphia, Lancaster, Aliquippa, and Allentown. Search by ZIP code or city below to find the closest one, or filter by product type if you are after a specific format.
Market Insights Snapshot
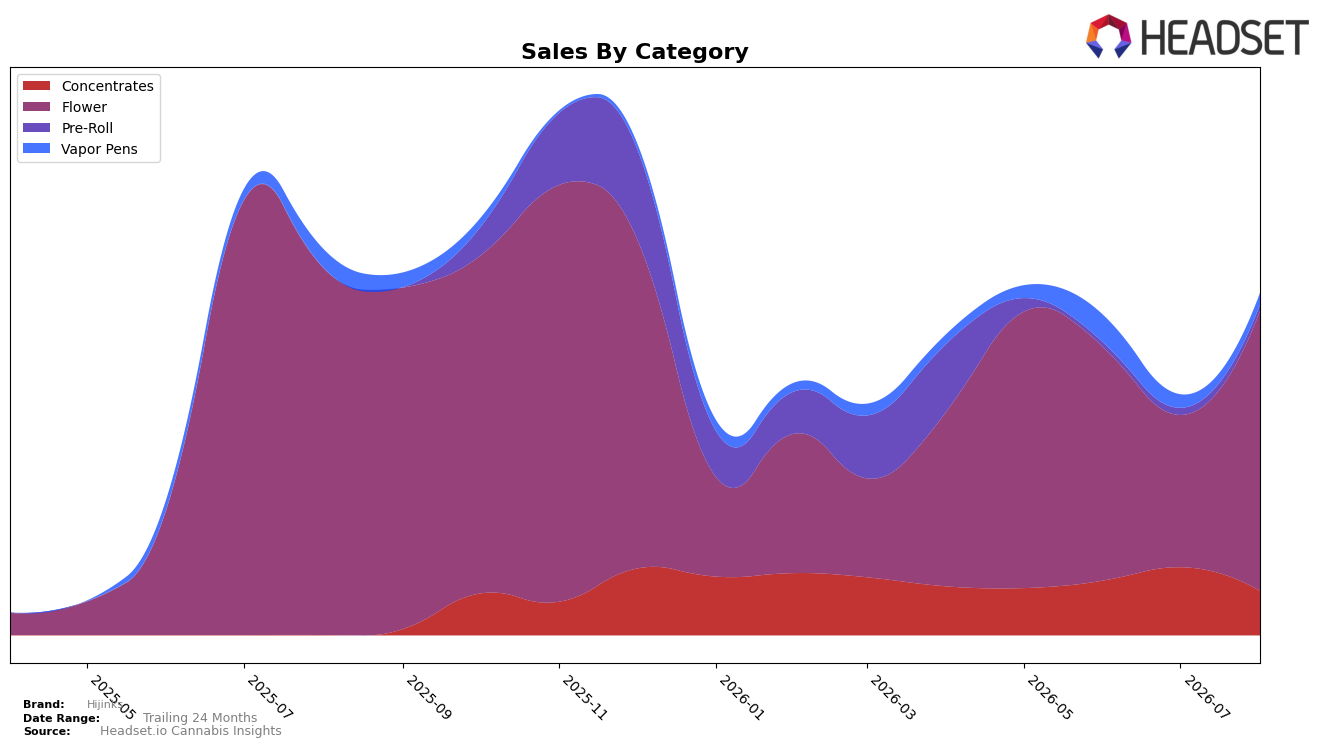
In August 2026, Hijinks concentrated 82.01% of sales in Flower, where category sales were down 23.80% year over year but up 84.13% month over month, while Vapor Pens held 3.40% share with a 36.76% YoY decline and a 12.08% MoM drop. Concentrates accounted for 12.94% share with a 34.92% MoM decline, and Pre-Roll sat at 1.65% share with a 16.22% MoM decrease; the overall brand saw average prices fall 13.63% YoY to $37.99 alongside a brand-level sales contraction of 11.50% YoY. Taken together, the sharp MoM rebound in Flower against broad MoM pullbacks elsewhere implies Hijinks is leaning harder into its core Flower lineup to stabilize volumes after price compression.
With Flower ranked 56 in Ohio, the 84.13% MoM surge paired with a 23.80% YoY decline suggests regained shelf momentum but not a shift in competitive tier, while categories under 5% share (Vapor Pens at 3.40% and Pre-Roll at 1.65%) continue to dilute scale. The 34.92% MoM contraction in Concentrates alongside a 12.08% MoM slide in Vapor Pens, against a 13.63% YoY drop in average price, indicates that price-led tactics are most effective in Flower rather than in smaller categories. The pattern implies Hijinks’s positioning is anchored in value-forward Flower where price cuts convert to volume, whereas peripheral categories are not yet large enough to counterbalance rank pressure in Flower.
Competitive Landscape
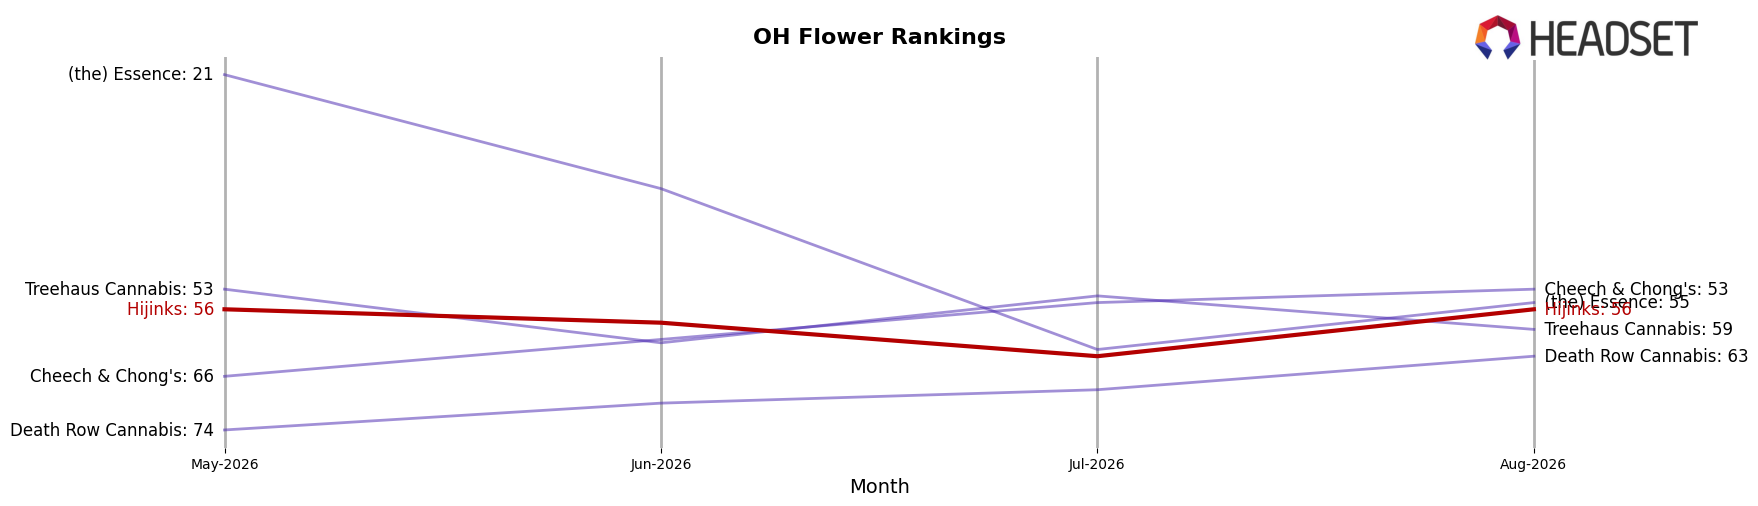
Hijinks sits at rank 56 in OH Flower in August 2026, down 12 positions year over year from rank 44, and flat versus May 2026 at rank 56, indicating both a YoY slide and recent stasis. At the top end, Klutch Cannabis advanced to rank 1 from rank 19 year over year while growing sales 362.3%, and RYTHM moved to rank 2 from rank 8 with sales up 27.3%, outpacing Hijinks’ trajectory and widening the competitive gap. Meanwhile, Riviera Creek slipped to rank 3 from rank 1 with sales down 28.4%, yet it remains 53 positions ahead of Hijinks, and Hijinks is also 18 spots below its peak rank of 38 from July 2025. The pattern implies Hijinks is losing relative position in a market where leaders are accelerating upward, so regaining share will likely require shifts that change its rank momentum rather than relying on category drift.
Notable Products
Purple Starfruit (7g) posted the standout movement in August 2026 with a +121.9% month-over-month surge that propelled it to rank 1, while California Lemon (3.5g) slid 46.2% MoM and held rank 7, signaling a shift toward larger pack sizes. Green Diesel (7g) was comparatively steady at -1.2% MoM in rank 5, and four of the top ten are Flower SKUs in 3.5g formats, yet the highest ranks are occupied by 7g packs, including one product at $20,046, indicating consumer trade-up. The pattern implies Hijinks is consolidating share at the top with value-forward 7g offerings while select 3.5g items lose velocity.
Top Selling Cannabis Brands






Data for this report comes from real-time sales reporting by participating cannabis retailers via their point-of-sale systems, which are linked up with Headset’s business intelligence software. Headset’s data is very reliable, as it comes digitally direct from our partner retailers. However, the potential does exist for misreporting in the instance of duplicates, incorrectly classified products, inaccurate entry of products into point-of-sale systems, or even simple human error at the point of purchase. Thus, there is a slight margin of error to consider. Brands listed on this page are ranked in the top twenty within the market and product category by total retail sales volume.

