.svg)

Aug-2026
Sales
Trend
6-Month
Product Count
SKUs
Avg Price
YoY Sales Change
YoY Price Change


Where to Buy
ILL Exotics is stocked at 32 licensed dispensaries across Michigan, with the deepest coverage in Detroit, New Buffalo, Lansing, Battle Creek, and Grand Rapids. Search by ZIP code or city below to find the closest one, or filter by product type if you are after a specific format.
Market Insights Snapshot
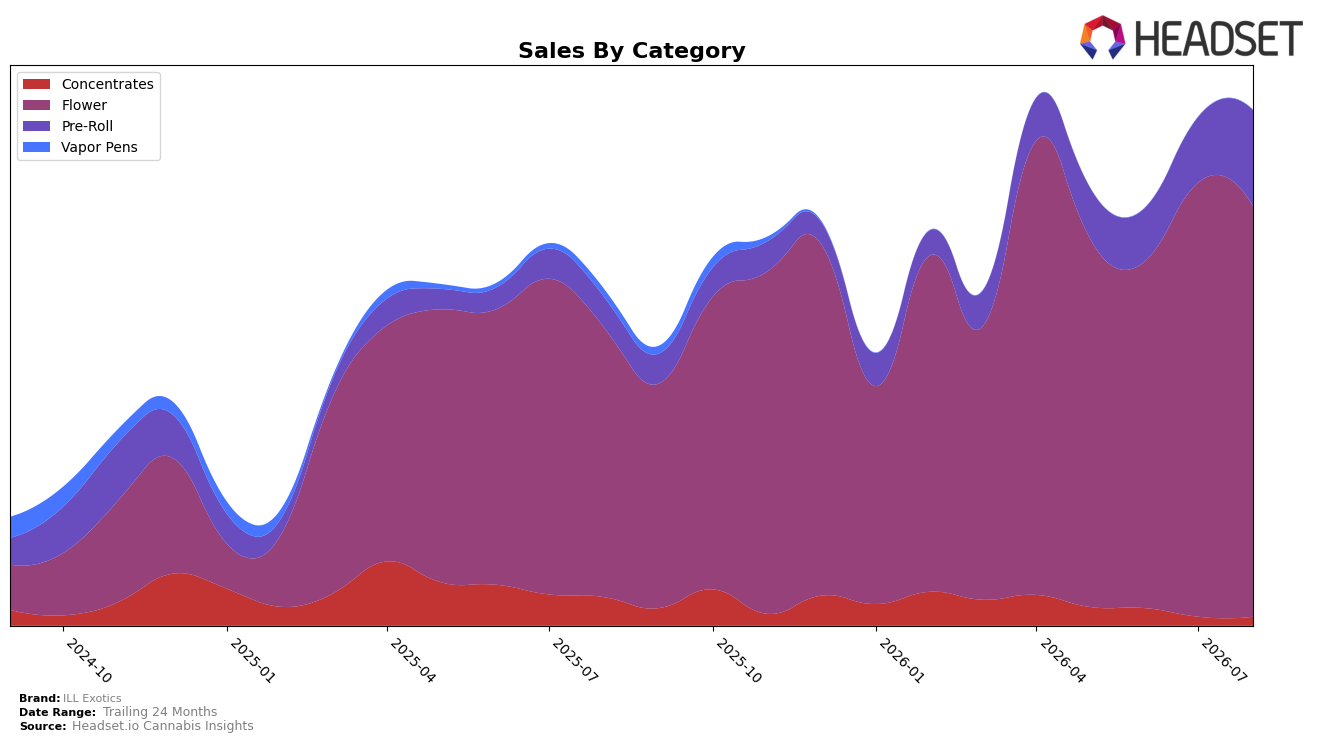
ILL Exotics concentrated 79.66% of August 2026 sales in Flower with a 52.22% year-over-year increase but a 5.59% month-over-month decline, while Pre-Roll rose to an 18.66% mix with 216.76% year-over-year growth and 46.66% month-over-month expansion. Concentrates slipped to a 1.68% share with a 69.35% year-over-year contraction and only 0.28% month-over-month movement, and the brand's average price dipped 0.54% year-over-year to $24.04. In Michigan Flower, the brand sat at rank 33, indicating that Pre-Roll’s rapid mix gain is offsetting Flower’s monthly softness, implying a pivot toward formats driving velocity rather than relying solely on core Flower.
With Pre-Roll expanding its share by 46.66% month-over-month alongside a 216.76% year-over-year surge, the portfolio is tilting toward a lower-priced, faster-turn format relative to Flower’s 5.59% month-over-month decline and 52.22% year-over-year growth. Holding rank 33 in Michigan Flower while Flower carries 79.66% of mix implies concentration risk; the concurrent 0.54% year-over-year price decrease and Pre-Roll mix accretion suggest the brand is trading for basket penetration and distribution gains rather than premium positioning.
Competitive Landscape
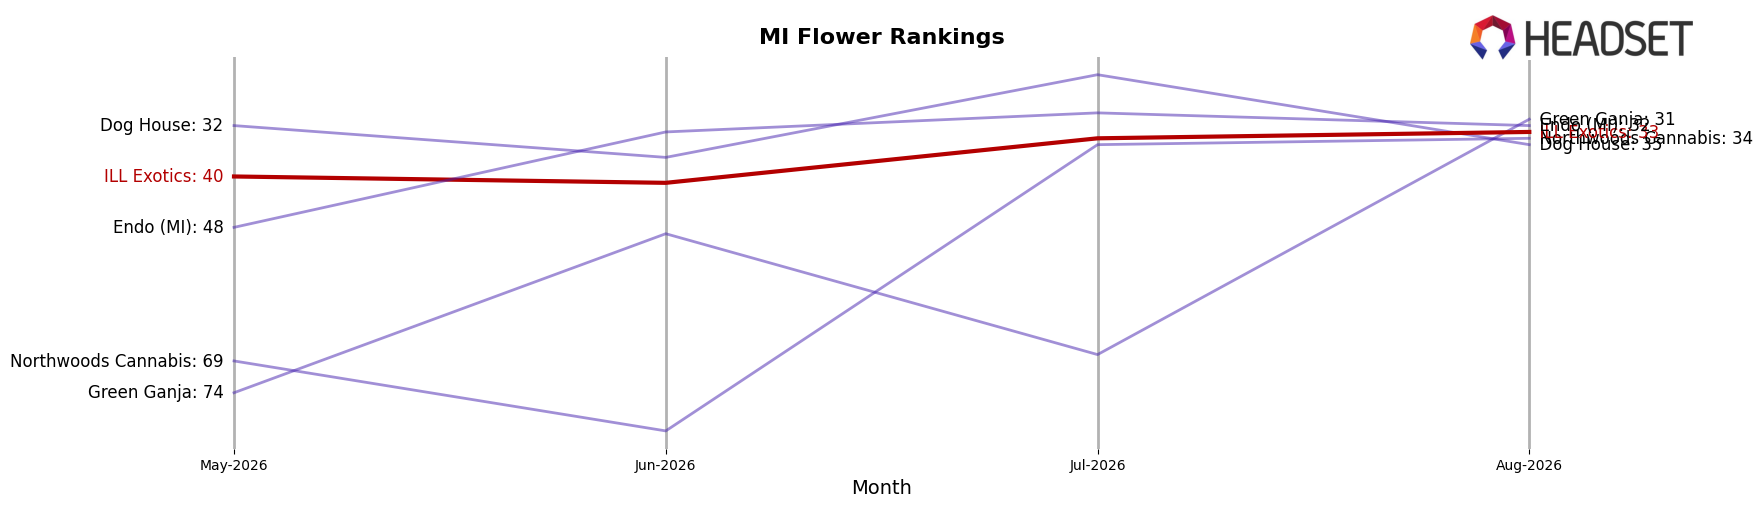
ILL Exotics is ranked #33 in MI Flower in August 2026, improving 27 positions from #60 year over year, and edging up 7 spots from #40 three months ago; this sits just one notch below its peak of #32 reached in April 2026, indicating incremental gains rather than a breakout. In contrast, NOBO surged from #42 to #3 year over year while posting a 506.8% sales increase, and High Minded held #1 despite a 17.4% YoY sales decline, illustrating that leadership is attainable even with negative comps. With top-five positions relatively stable for Society C at #2 (up 0 ranks YoY with 2.7% YoY sales growth) and Goodlyfe Farms at #4 (down 1 rank YoY with a 2.2% sales decline), ILL Exotics’ climb of 27 ranks YoY but only 1 rank off its April 2026 peak implies a trajectory of steady rank consolidation that will likely require discrete share wins to break into the top 30.
Notable Products
Scented Marker (Bulk) posted the steepest movement in August 2026 with a -50.9% month-over-month drop and a rank position of 5, implying demand is consolidating away from mid-table SKUs while top spots are defended by faster growers. Western Runtz (Bulk) delivered a +71.7% month-over-month surge to rank 3, while Orange Push Pop (Bulk) grew +35.8% to rank 1, indicating momentum is concentrating at the very top of the lineup. Eight of the top ten are Flower SKUs, and the top three ranks are all Flower, which suggests the portfolio is skewing toward bulk Flower velocity over breadth, pointing to a strategy that prioritizes a narrower set of high-turn winners even as laggards retrench.
Top Selling Cannabis Brands






Data for this report comes from real-time sales reporting by participating cannabis retailers via their point-of-sale systems, which are linked up with Headset’s business intelligence software. Headset’s data is very reliable, as it comes digitally direct from our partner retailers. However, the potential does exist for misreporting in the instance of duplicates, incorrectly classified products, inaccurate entry of products into point-of-sale systems, or even simple human error at the point of purchase. Thus, there is a slight margin of error to consider. Brands listed on this page are ranked in the top twenty within the market and product category by total retail sales volume.

