Jun-2026
Sales
Trend
6-Month
Product Count
SKUs
Avg Price
YoY Sales Change
YoY Price Change
Market Insights Snapshot
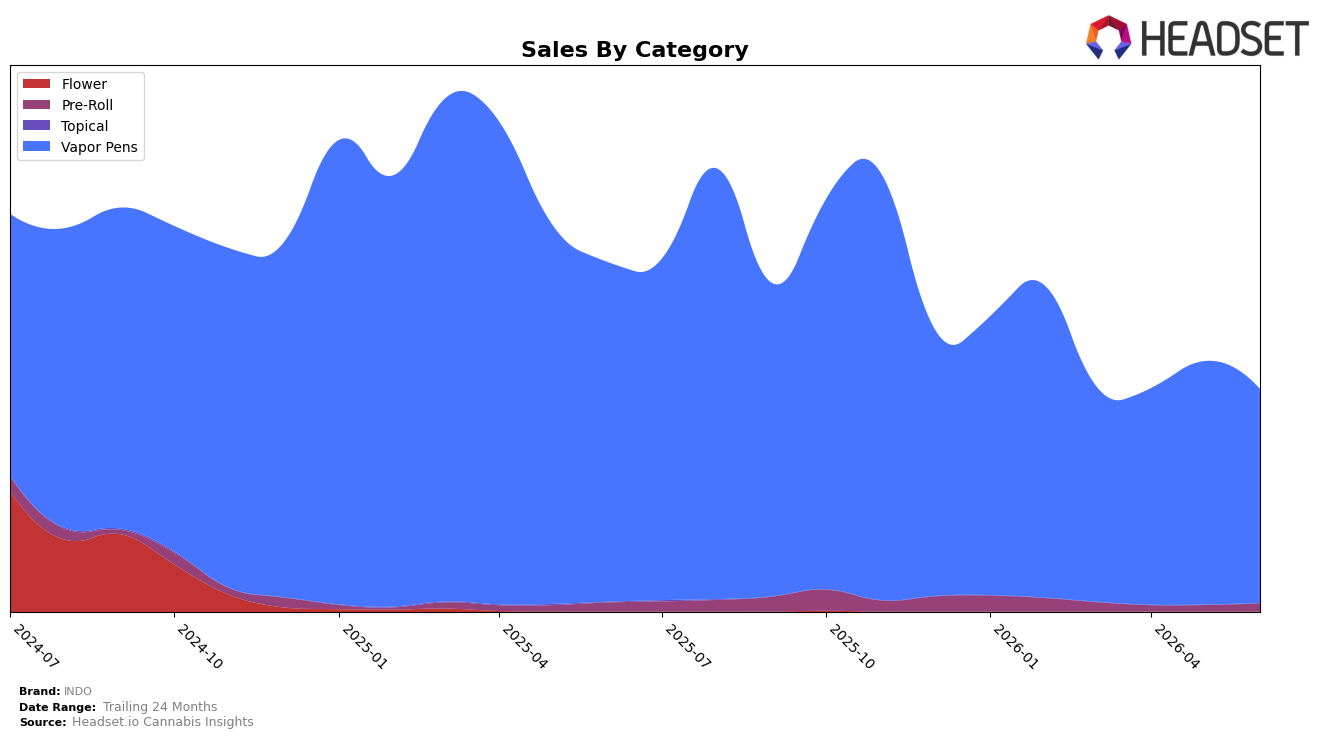
INDO’s mix in June 2026 is concentrated in Vapor Pens at 96.56% share with a year-over-year decline of 37.03% and a month-over-month drop of 12.14%, while Pre-Roll holds 3.44% share with an 11.05% year-over-year decline but a 26.68% month-over-month rise. Average price is up 3.43% year over year to $31.61, with category-level pricing at $31.58 for Vapor Pens and $32.31 for Pre-Roll, indicating a slight premium shift as total brand sales fell 36.43% year over year. The pattern implies heavy reliance on a contracting Vapor Pens base alongside a small but faster-growing Pre-Roll contribution, pointing to concentration risk and a need to nurture the expanding niche to offset category drag.
Positioning-wise, a 96.56% tilt to Vapor Pens paired with a 12 rank in Nevada Vapor Pens suggests mid-pack presence that is vulnerable when the core category posts a 12.14% month-over-month decline and a 37.03% year-over-year drop. The 26.68% month-over-month lift in Pre-Roll and its narrower 11.05% year-over-year decline indicate a viable secondary pillar, while the 3.43% brand-level price increase alongside a 36.43% sales contraction suggests elastic demand in the core. The implication is to reposition from near-single-category dependence toward a two-pillar mix where incremental gains in Pre-Roll can stabilize share as Vapor Pens volatility persists.
Competitive Landscape
INDO sits at rank #12 in Nevada Vapor Pens for June 2026, down 1 position year over year from #11 while improving 3 spots since March 2026 when it was #15; the brand is also 5 places off its February 2026 peak at #7, indicating a retracement from earlier momentum. Competitively, Rove moved up from #2 to #1 despite a -19.3% YoY sales change, while STIIIZY slipped from #1 to #2 with a deeper -28.9% YoY decline, and AiroPro jumped from #12 to #5 on +82.9% YoY sales growth, widening the competitive gap above the mid-tier where INDO currently competes; this rank trajectory implies INDO is stabilizing mid-pack rather than reclaiming its February 2026 top-10 position unless relative velocity improves against faster-rising rivals.

Notable Products
Strawberry Lemonade Botanical Terpene Distillate Disposable (1g) posted the steepest movement in June 2026 with a -65.3% month-over-month drop while sitting at rank 5, contrasting with Skywalker OG Distillate Disposable (2g) at rank 1 down -19.6% and Bubble Kush Distillate Disposable (1g) at rank 2 down -49.0%. Three of the top five ranks declined by double digits in June 2026, and Vapor Pens account for 10 of the top 10 SKUs, indicating a category-heavy portfolio that is compressing at the top despite a 29.4% rise for Indopuff - Pineapple Jack Distillate Disposable (0.9g) at rank 3. The mix implies INDO is over-indexed in Vapor Pens and is relying on a narrow set of SKUs where volatility at ranks 1–5 can quickly swing monthly revenue, with June 2026 concentration risk outweighing isolated gains.
Top Selling Cannabis Brands
Data for this report comes from real-time sales reporting by participating cannabis retailers via their point-of-sale systems, which are linked up with Headset’s business intelligence software. Headset’s data is very reliable, as it comes digitally direct from our partner retailers. However, the potential does exist for misreporting in the instance of duplicates, incorrectly classified products, inaccurate entry of products into point-of-sale systems, or even simple human error at the point of purchase. Thus, there is a slight margin of error to consider. Brands listed on this page are ranked in the top twenty within the market and product category by total retail sales volume.

