Jun-2026
Sales
Trend
6-Month
Product Count
SKUs
Avg Price
YoY Sales Change
YoY Price Change
Market Insights Snapshot

LEIFFA’s June 2026 mix is concentrated in Flower at 46.13% share (yoy +158.43%, mom -36.53%) and Concentrates at 45.93% share (yoy +306.73%, mom +7.34%), with Vapor Pens at 6.75% (yoy -42.10%, mom +6.10%) and minor positions in Edible at 0.87% (yoy +34.71%, mom -34.36%) and Pre-Roll at 0.30% (yoy -70.96%, mom -65.31%). Average price rose 95.99% year over year to $17.45 while brand sales grew 135.28% yoy, indicating mix-driven and price-led expansion despite Flower’s month-over-month pullback; the pattern implies LEIFFA is reallocating toward higher-priced Concentrates to offset Flower volatility and sustain growth.
With Flower ranked 19 in Colorado and posting a -36.53% month-over-month dip alongside a +7.34% month-over-month lift in nearly equally sized Concentrates, the brand’s risk is shifting from volume-dependent Flower to margin-accretive Concentrates whose +306.73% year-over-year surge can absorb Vapor Pens’ -42.10% year-over-year drag. The combination of a 46.13%/45.93% split between Flower and Concentrates and a 95.99% year-over-year price increase implies a pricing-and-mix strategy that prioritizes Concentrates to stabilize revenue against seasonal Flower swings and to reposition LEIFFA toward premium extraction while maintaining core Flower scale.
Competitive Landscape
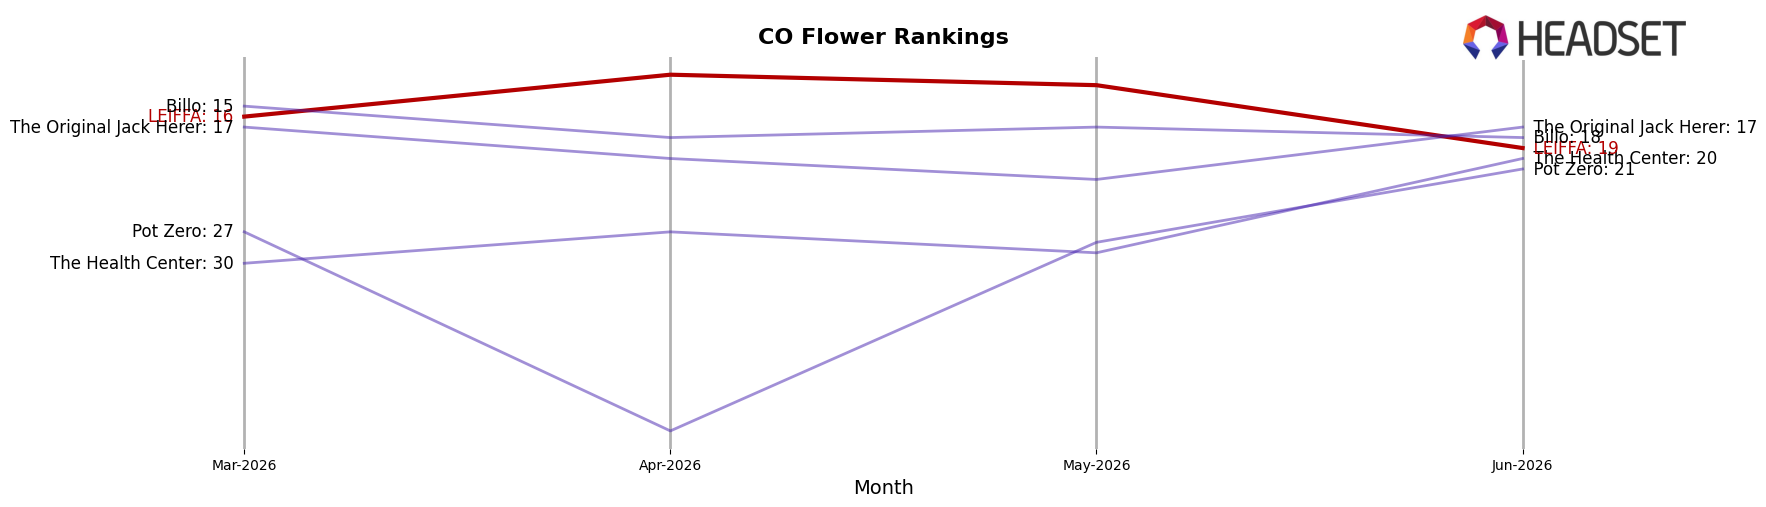
LEIFFA sits at rank #19 in June 2026 in CO Flower, improving 32 places year over year from #51 but slipping 3 positions since March 2026 when it was #16; against its December 2024 peak of #7, the current spot marks a 12-rank retreat. Competitive pressure is acute at the top: Seed & Strain Cannabis Co. rose from #2 to #1 with 62.8% YoY sales growth, while Good Chemistry Nurseries fell from #1 to #3 with a 2.8% YoY decline, indicating share is rotating upward toward faster growers. Meanwhile, Natty Rems vaulted from #28 to #5 on 221.0% YoY growth, outpacing LEIFFA’s rank momentum and narrowing room for mid-tier gains; this pattern implies LEIFFA’s YoY climb is real but its near-term trajectory is flattening as ascendant rivals compress the mid-pack and pull the category’s growth toward the top quintile.
Notable Products
Tangie Cookie Burger (3.5g) posted the steepest decline in June 2026 at -81.3% MoM while sliding to rank 9, and Dulce De Uva (Bulk) fell -73.2% MoM despite holding rank 1; this pairing indicates volume leadership concentrated in SKUs with sharp short-term contraction. Pink Guava (Bulk) dropped -52.3% MoM at rank 2 and Pineapple Cake (Bulk) declined -62.0% MoM at rank 6, while four of the top ten are Flower SKUs ranked 1–3 and 5–7, signaling a category-heavy slate with synchronized pullback. Red Runtz Cold Cure Live Rosin (1g) entered at rank 4 with $24,776 and no prior baseline, contrasting with Hot Rod (Bulk) at -46.5% MoM in rank 3 to show concentrates gaining relative placement as flagship flowers retrench. The pattern implies LEIFFA’s commercial direction is tilting toward a more diversified mix where concentrates can offset Flower volatility and absorb rank share when core Flower SKUs contract.
Top Selling Cannabis Brands
Data for this report comes from real-time sales reporting by participating cannabis retailers via their point-of-sale systems, which are linked up with Headset’s business intelligence software. Headset’s data is very reliable, as it comes digitally direct from our partner retailers. However, the potential does exist for misreporting in the instance of duplicates, incorrectly classified products, inaccurate entry of products into point-of-sale systems, or even simple human error at the point of purchase. Thus, there is a slight margin of error to consider. Brands listed on this page are ranked in the top twenty within the market and product category by total retail sales volume.

