.svg)


Where to Buy
Lemonnade is stocked at 45 licensed dispensaries across California, Florida, and 3 other states, 27 of them in California, with the deepest coverage in Los Angeles, Modesto, San Jose, Bishop, and Corona. Search by ZIP code or city below to find the closest one, or filter by product type if you are after a specific format.
Market Insights Snapshot
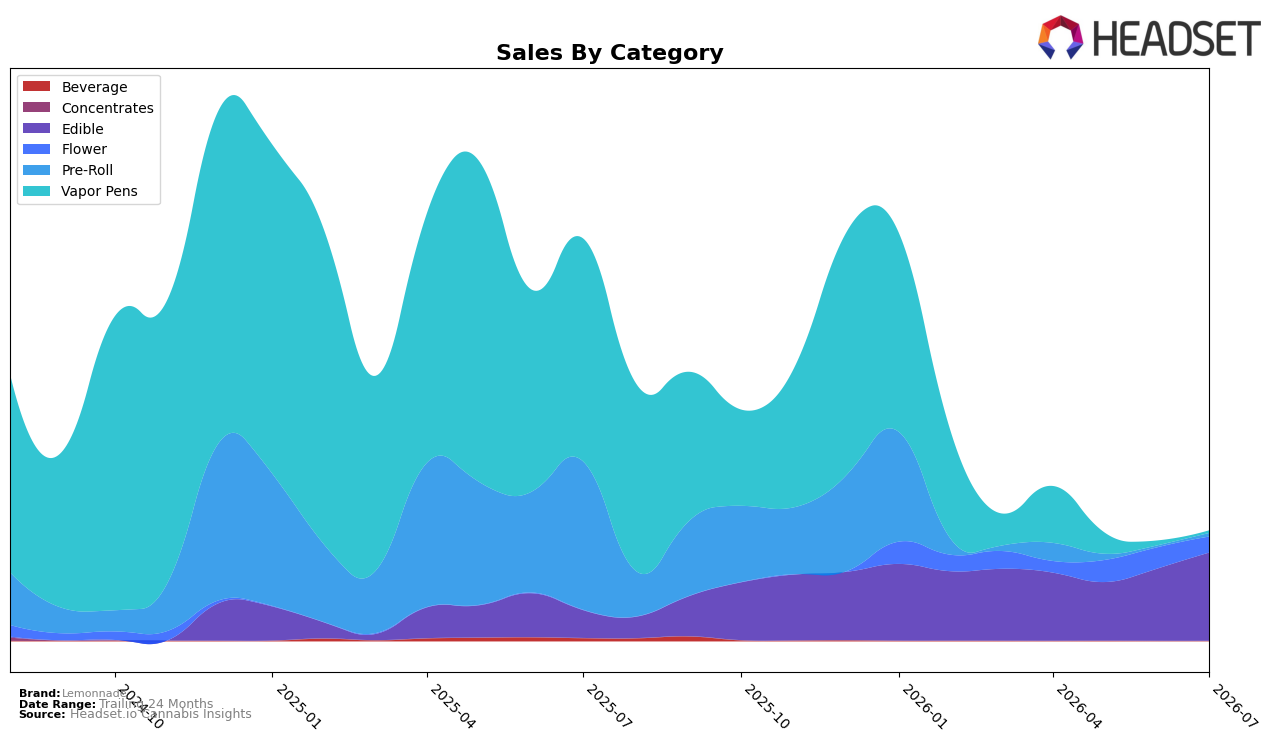
Lemonnade’s July 2026 mix is concentrated in Edible at 80.51% share with 219.15% YoY growth and 22.11% MoM, while Flower holds 14.38% share with 17,163.13% YoY but a -25.22% MoM pullback; Pre-Roll at 2.98% shows -97.80% YoY yet a 109.95% MoM rebound, and Vapor Pens at 2.14% posts -98.95% YoY and -48.91% MoM. Despite the brand’s overall -72.79% YoY sales decline and a -32.80% YoY average price move to $10.71, the category mix is pivoting toward Edible momentum and selective Flower recovery, implying a consolidation around formats with current month stability and away from Vapor Pens’ contraction.
The mix shift increases reliance on Edible growth to offset volatility elsewhere, but the -25.22% MoM in Flower alongside a 17,163.13% YoY surge suggests distribution or SKU re-entry dynamics that may not sustain share if Pre-Roll’s 109.95% MoM uptick scales from its 2.98% base. In Illinois Edible, Lemonnade’s rank at 41 and an 80.51% portfolio weight indicate a follower stance that trades breadth for depth; this positioning can improve efficiency if July 2026 Edible MoM of 22.11% persists, but the -48.91% MoM in Vapor Pens and sub-3% shares in two categories cap upside unless Edible gains translate into rank lifts or Flower stabilizes quarter-over-quarter.
Competitive Landscape
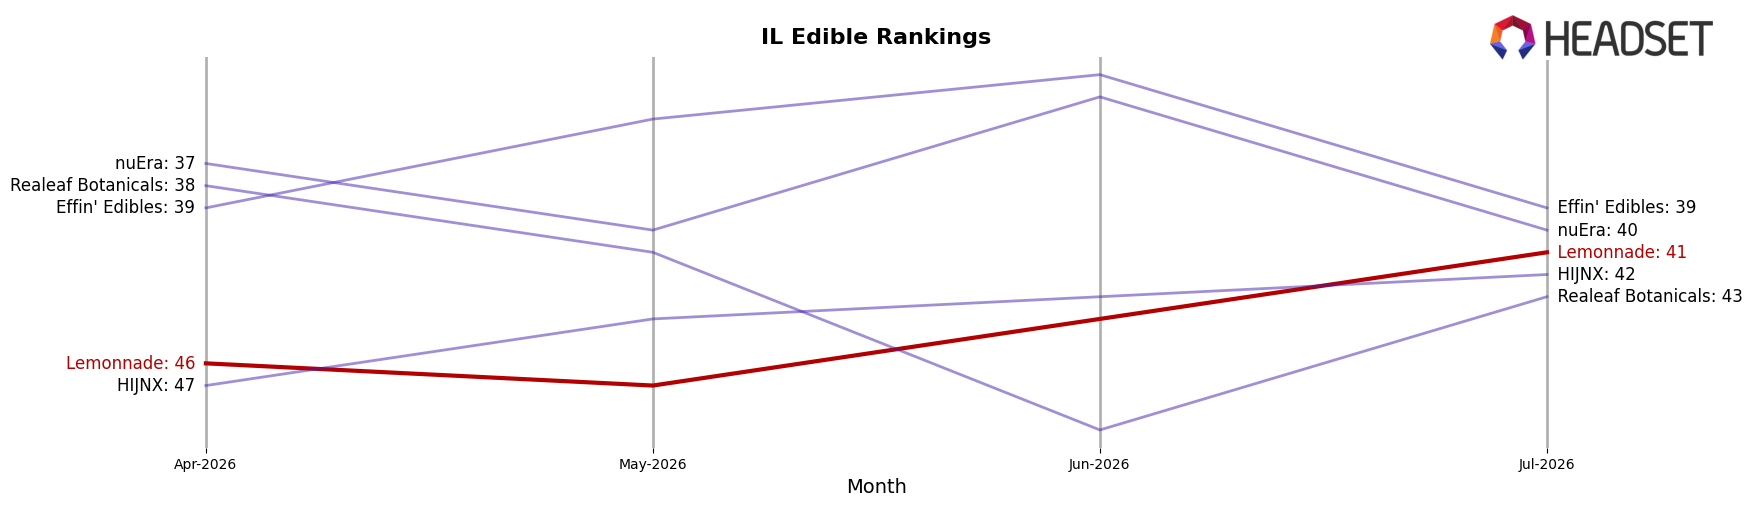
Lemonnade sits at rank #41 in IL Edible in July 2026, improving 5 positions from #46 in April 2026, while also marking a peak rank of #41 in July 2026; the lack of a year-over-year rank figure contrasts with Incredibles holding #1 with a +3 YoY rank gain and Wyld at #2 with a +1 YoY rank gain despite a -11.79% YoY sales change. Against this backdrop, Gron / Grön moved to #4 with a +13 YoY rank change alongside +100.16% YoY sales growth, and Savvy holds #5 after a +7 YoY rank change and +16.69% YoY sales growth; the directional gap indicates Lemonnade’s near-term climb of 10.9% in rank position from April 2026 to July 2026 is outpaced by competitors compounding multi-period gains. The pattern implies Lemonnade’s recent upward drift is insufficient for top-tier contention without accelerating velocity, as rivals converting double-digit YoY rank gains are widening separation despite some headwinds at the category’s #2 spot.
Notable Products
Horchata Infused Flower (3.5g) delivered the most abrupt swing in July 2026 with a 299% month-over-month surge, vaulting into a tie for rank 7 while Pink Lemonade Infused (3.5g) sank 66% and slid to rank 9. Lemon Beltz Gummies 10-Pack (100mg) rose 61% to rank 1 and Sour Mango Gummies 10-Pack (100mg) gained 13% at rank 2, while Grape Gas Infused (3.5g) dropped 47% despite occupying rank 7 alongside Horchata Infused Flower (3.5g). Five of the top ten are Edible SKUs clustered in ranks 1–5, and Watermelon Mojito Gummies 10-Pack (100mg) edged down 2% at rank 4, indicating the gummies core is stable even as Flower volatility reshuffles mid-table positions. The pattern implies Lemonnade’s commercial direction is consolidating around Edibles for reliable throughput while selectively leaning into opportunistic Flower spikes for incremental lift.
Top Selling Cannabis Brands






Data for this report comes from real-time sales reporting by participating cannabis retailers via their point-of-sale systems, which are linked up with Headset’s business intelligence software. Headset’s data is very reliable, as it comes digitally direct from our partner retailers. However, the potential does exist for misreporting in the instance of duplicates, incorrectly classified products, inaccurate entry of products into point-of-sale systems, or even simple human error at the point of purchase. Thus, there is a slight margin of error to consider. Brands listed on this page are ranked in the top twenty within the market and product category by total retail sales volume.

