.svg)


Market Insights Snapshot
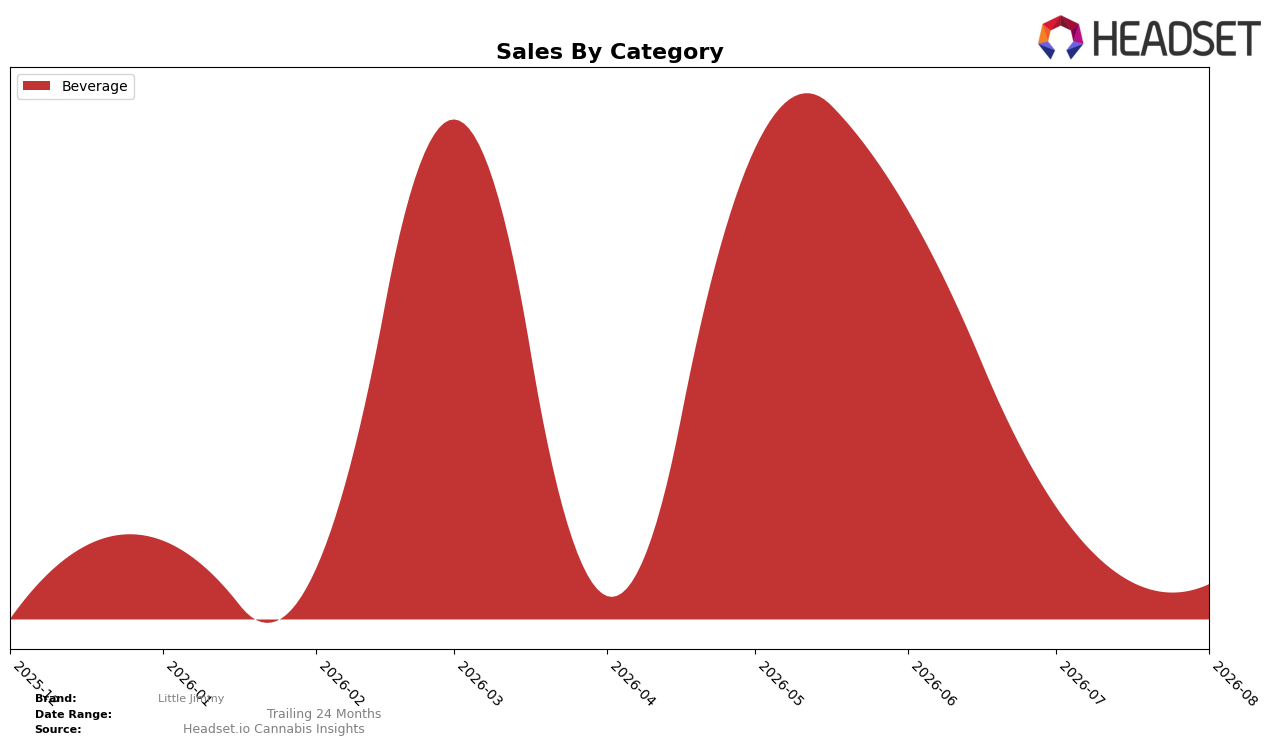
In August 2026, Little Jimmy operated as a single-category brand with Beverage at 100.0% share and a month-over-month change of -51.94%, while year-over-year change was not reported for the category. The average price sat at $4.05 alongside 100.0% mix concentration, indicating no diversification, and the Maryland Beverage rank was unreported, leaving rank momentum unclear. The pattern implies a concentrated portfolio exposed to volatility, with a 51.94% MoM contraction in its only category and a 100.0% single-category mix increasing sensitivity to short-term demand swings.
The 100.0% reliance on Beverage combined with a -51.94% MoM swing suggests positioning risk tied to seasonal or promotional cycles, and the absence of a reported rank in Maryland Beverage reduces visibility into competitive standing. With average price at $4.05 amid a fully concentrated mix and a large MoM decline, the brand’s positioning leans toward volume-driven tactics rather than price-led differentiation. The pattern implies that without category adjacencies to buffer volatility, Little Jimmy’s August 2026 footprint is shaped more by mix concentration than pricing power, raising the need for either stabilization within Beverage or selective expansion to reduce exposure.
Competitive Landscape
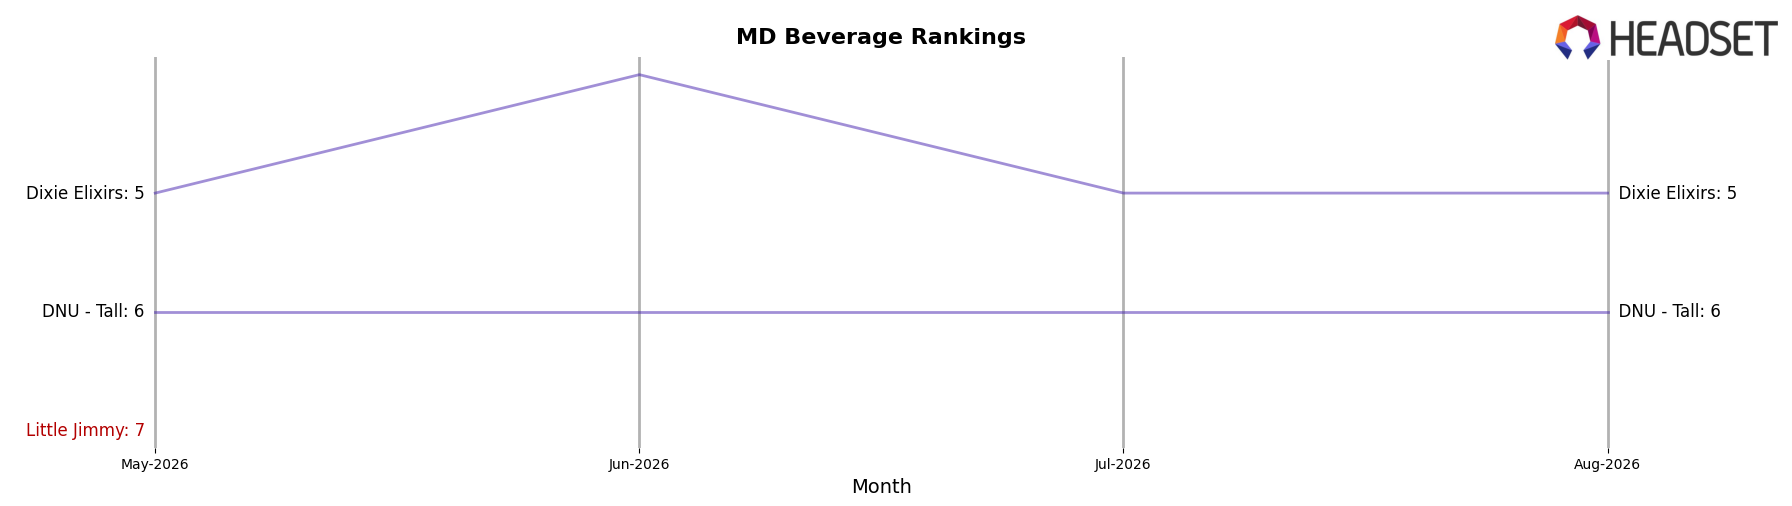
Little Jimmy sits at #8 in MD Beverage in August 2026 with a 1-place slippage from its three-month position of #7, and its peak rank of #7 in July 2026 underscores a recent downshift rather than a year-over-year move (no YoY rank available). In contrast, Keef Cola held #1 with a +5.94% YoY sales gain while Little Jimmy ceded a rank position month-on-month, and Vibations advanced from #3 YoY to #2 with +73.94% YoY sales growth as Little Jimmy moved from #7 to #8 over the last three months. With Dixie Elixirs slipping from #4 YoY to #5 on -12.45% YoY sales while Little Jimmy dropped 1 rank from July 2026 to August 2026, the pattern implies Little Jimmy is vulnerable to faster-growing peers and must reverse recent monthly share pressure to avoid drifting out of the top 10.
Notable Products
Immuni Tea Shot (10mg THC, 12oz, 355ml) posted the steepest decline in August 2026 at -77.5% MoM and slid to rank 4, while CBD/THC/CBG/CBC Tranquili Tea Shot (20mg CBD, 10mg THC, 10mg CBG, 5mg CBC) fell -54.7% MoM at rank 3. Paradise Tea Shot (10mg THC, 12oz, 355ml) remained rank 1 despite a -30.3% MoM drop and CBN/THC 1:1 Sereni Tea Shot (10mg CBN, 10mg THC, 12oz, 355ml) held rank 2 at -42.7% MoM, with three of the top four positions concentrated in Beverage shots indicating category-wide pressure. Paradise Tea Shot generated $528 in August 2026, but the uniform double-digit contractions across ranks 1–4 imply a volume reset rather than isolated SKU weakness.
Top Selling Cannabis Brands






Data for this report comes from real-time sales reporting by participating cannabis retailers via their point-of-sale systems, which are linked up with Headset’s business intelligence software. Headset’s data is very reliable, as it comes digitally direct from our partner retailers. However, the potential does exist for misreporting in the instance of duplicates, incorrectly classified products, inaccurate entry of products into point-of-sale systems, or even simple human error at the point of purchase. Thus, there is a slight margin of error to consider. Brands listed on this page are ranked in the top twenty within the market and product category by total retail sales volume.

