Apr-2025
Sales
Trend
6-Month
Product Count
SKUs
Avg Price
YoY Sales Change
YoY Price Change
Market Insights Snapshot
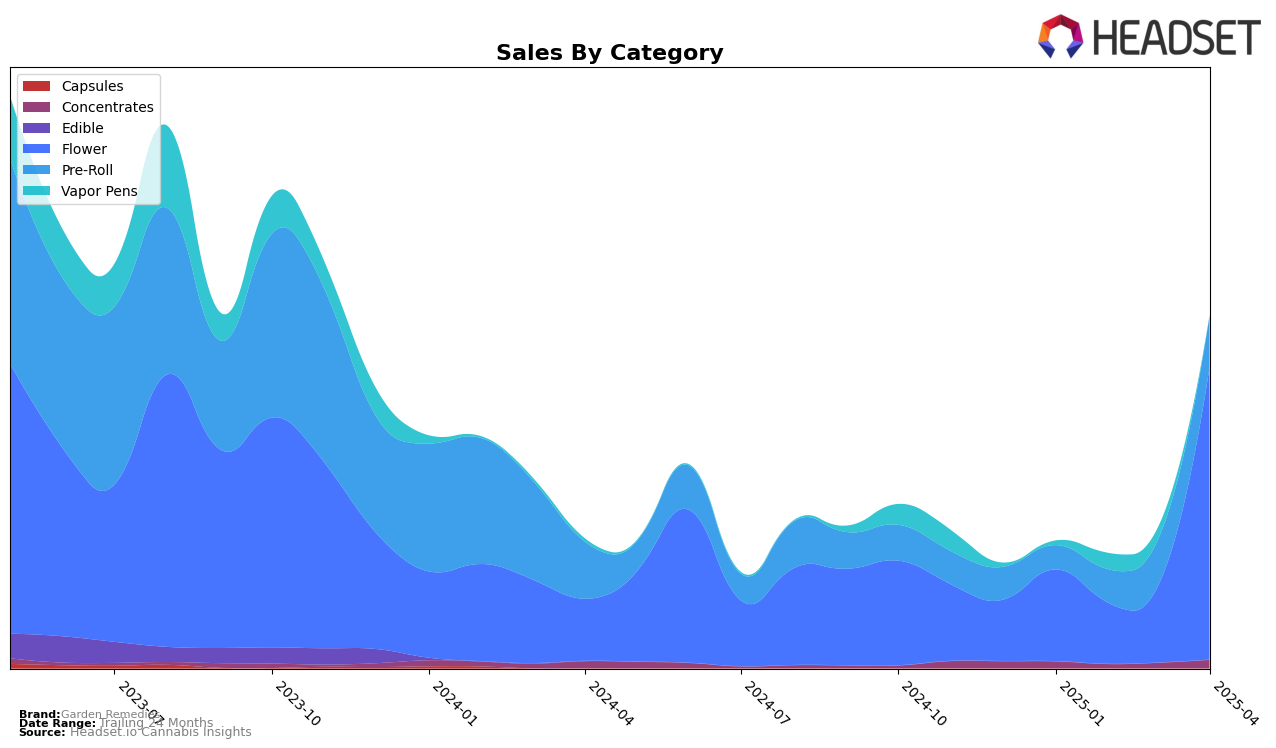
Garden Remedies has shown a mixed performance across different product categories in Massachusetts. In the Flower category, the brand has made a significant leap from being ranked 77th in March 2025 to 26th in April 2025, indicating a strong upward trend in this segment. This improvement is noteworthy considering that their sales in April reached $434,672, a substantial increase from previous months. However, in the Concentrates category, Garden Remedies did not make it to the top 30 rankings over the first four months of 2025, which suggests potential challenges or a lack of focus in this area.
The performance in the Pre-Roll category has been relatively stable, maintaining a consistent presence within the top 100, with a rank of 71st in both March and April 2025. This consistency indicates steady consumer interest in their pre-roll products. On the other hand, the Vapor Pens category saw a decline, with the brand dropping out of the top 30 by April, after being ranked 84th in February. This could be a signal of waning interest or increased competition in that category. Overall, while Garden Remedies has shown promising growth in the Flower category, it faces challenges in other segments that may require strategic adjustments to improve their market position across the board.
Competitive Landscape
In the Massachusetts flower category, Garden Remedies experienced a significant fluctuation in its competitive ranking and sales trajectory from January to April 2025. Initially ranked at 69th in January, Garden Remedies saw a decline to 82nd in February, before rebounding to 77th in March and making a substantial leap to 26th in April. This dramatic improvement in April suggests a strategic shift or successful marketing initiative that propelled the brand forward. In contrast, The Cure Company showed a consistent upward trend, moving from being unranked in February to 25th by April, indicating strong market penetration. Meanwhile, Nature's Heritage maintained a stable presence, hovering around the mid-20s rank, while Shaka Cannabis Company experienced a decline from 12th in January to 24th in April, potentially opening opportunities for Garden Remedies to capture market share. Additionally, Local Roots displayed a steady rank similar to Nature's Heritage, suggesting a competitive but stable landscape. The notable surge in Garden Remedies' rank and sales in April reflects a positive momentum that could be leveraged for further growth in the Massachusetts flower market.

Notable Products
In April 2025, Miss Lady Loud (3.5g) emerged as the top-performing product for Garden Remedies, leading the sales with a significant figure of 5228 units. Following closely, GovernMint Oasis (3.5g) climbed to the second position from its previous rank of fifth in January, with sales reaching 4827 units. GMO Pie (3.5g) secured the third spot, while Avocado Toast (3.5g) dropped to fourth from its earlier third position in March, achieving sales of 4236 units. Fat Cat (3.5g) rounded out the top five, maintaining a consistent performance. Overall, the rankings indicate a dynamic shift in consumer preferences, with several products experiencing notable ascensions in their standings over the months.
Top Selling Cannabis Brands
Data for this report comes from real-time sales reporting by participating cannabis retailers via their point-of-sale systems, which are linked up with Headset’s business intelligence software. Headset’s data is very reliable, as it comes digitally direct from our partner retailers. However, the potential does exist for misreporting in the instance of duplicates, incorrectly classified products, inaccurate entry of products into point-of-sale systems, or even simple human error at the point of purchase. Thus, there is a slight margin of error to consider. Brands listed on this page are ranked in the top twenty within the market and product category by total retail sales volume.

