May-2026
Sales
Trend
6-Month
Product Count
SKUs
Avg Price
YoY Sales Change
YoY Price Change
Market Insights Snapshot
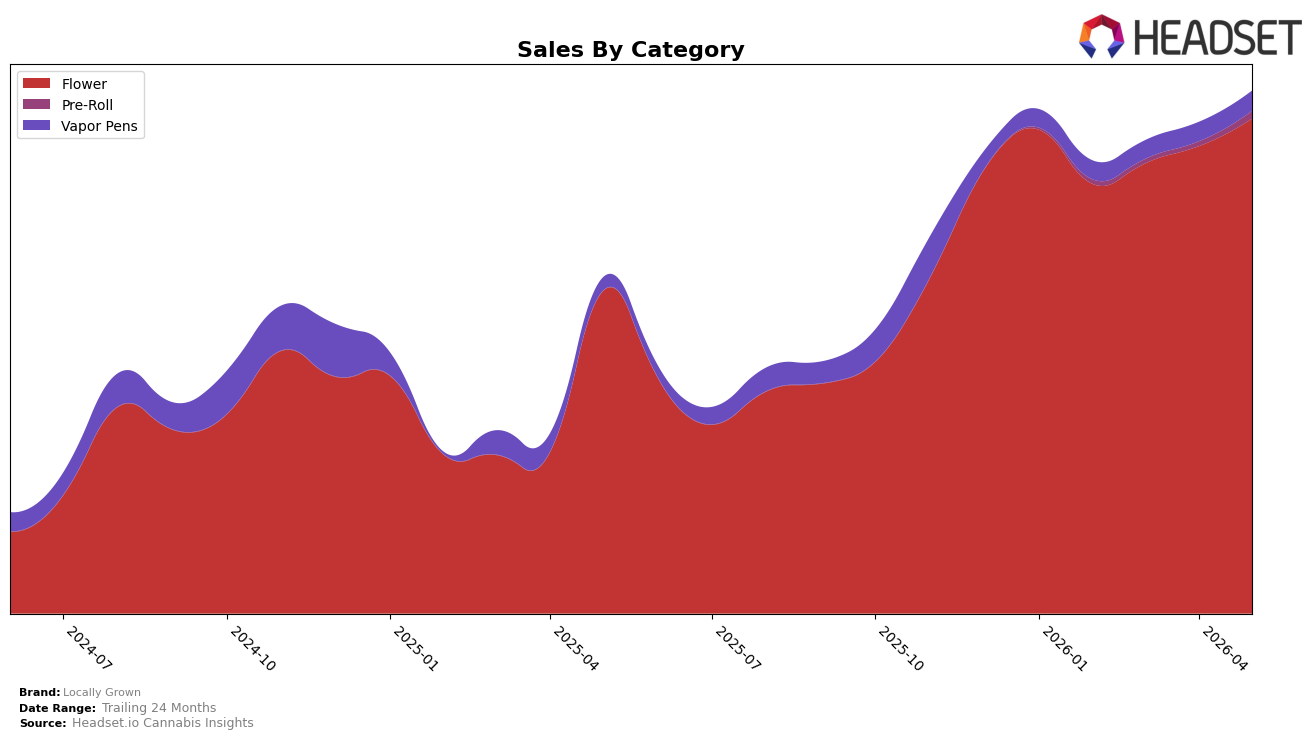
Locally Grown concentrated 94.79% of May 2026 sales in Flower, with Vapor Pens at 3.80% and Pre-Roll at 1.41%, signaling an even tighter skew than typical multi-category peers; Flower grew 53.33% YoY and 5.90% MoM while Vapor Pens grew 53.54% YoY and 4.28% MoM, and Pre-Roll spiked 66.08% MoM off a small base. The brand’s average price rose 9.55% YoY to $13.63 as Flower’s average price sat at $13.99 and Vapor Pens at $14.21, implying pricing power without visible volume erosion given brand-level sales up 55.52% YoY; the pattern implies a Flower-led engine that is expanding while adjacent form factors are being tested for complementary growth rather than diversification.
With a 9th rank in Flower in Ohio and 94.79% of mix anchored there, the 5.90% MoM Flower gain alongside a 66.08% MoM Pre-Roll surge suggests headroom to convert Flower equity into value-entry formats while maintaining premium-adjacent pricing signaled by a 9.55% YoY average price lift. The near-equal YoY growth rates of Flower at 53.33% and Vapor Pens at 53.54% indicate that cross-format demand likely stems from shared strain or brand equity rather than price-only switching, so sustaining the mix while letting Pre-Roll absorb price-sensitive demand could stabilize rank trajectory in Flower and improve basket breadth without diluting the 94.79% core.
Competitive Landscape
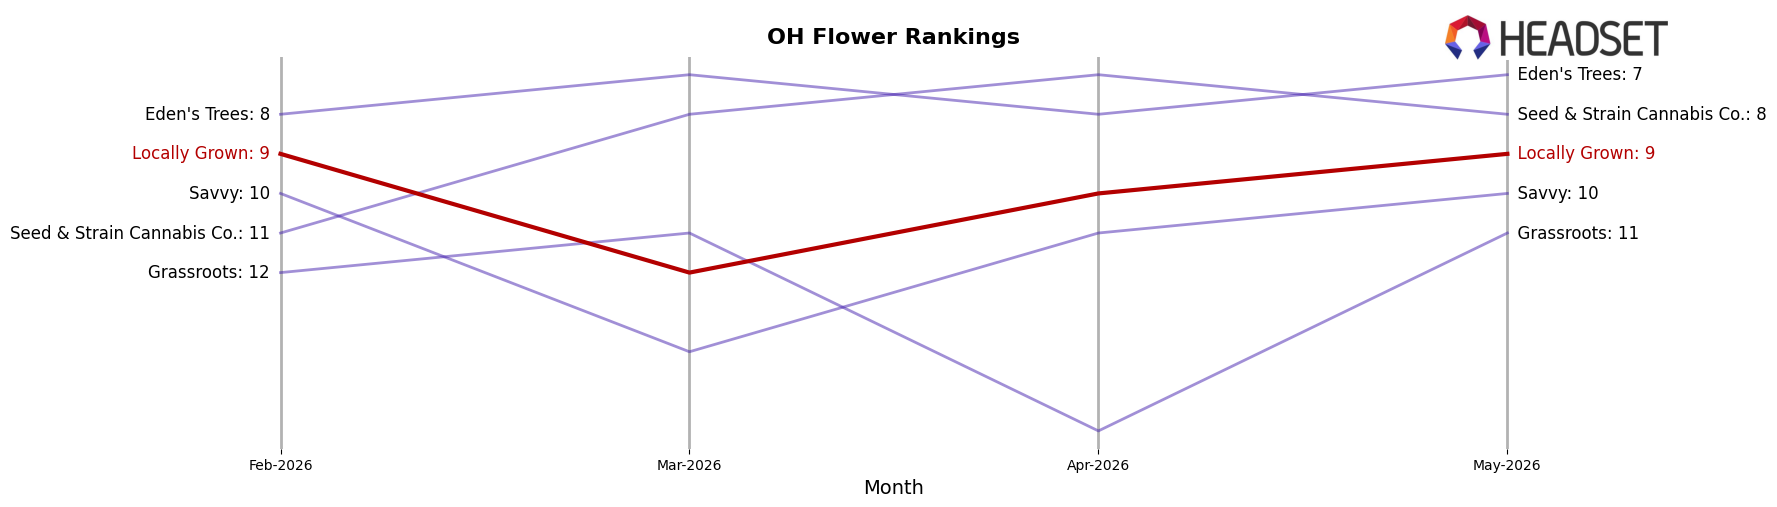
Locally Grown sits at rank #9 in OH Flower in May 2026, improving 3 positions from #12 year over year, while holding flat versus February 2026 at #9; this stability at its peak rank (#9) contrasts with RYTHM rising from #7 to #2 and Klutch Cannabis jumping from #16 to #3, and diverges from Buckeye Relief slipping from #1 to #5 alongside a 31.3% year-over-year sales decline. With market leaders splitting—Riviera Creek easing from #2 to #1 despite a 10.1% sales dip and Neighborgoods edging down from #3 to #4 with a 1.7% decline—Locally Grown’s unchanged #9 across the last three months and a 3-rank YoY gain suggest the brand is consolidating a lower–top-10 foothold while faster climbers compress headroom above.
Notable Products
Sinmints (2.83g) posted the largest month-over-month gain at +197.7% while climbing to rank 3, outpacing Gem City Funk (2.83g) at +165.8% that moved into rank 1. In contrast, #72 (2.83g) fell -23.6% to rank 5 and Neon Gem (2.83g) declined -34.1% to rank 7, indicating share rotation within the lineup. Four of the top ten are Flower SKUs in the top five ranks, with May 2026 concentration at ranks 1–5 anchored by double- and triple-digit MoM increases and tempered by two double-digit decliners. The pattern implies Locally Grown is consolidating demand into a narrower set of Flower winners, prioritizing depth in breakthrough SKUs over breadth across mid-tier items.
Top Selling Cannabis Brands
Data for this report comes from real-time sales reporting by participating cannabis retailers via their point-of-sale systems, which are linked up with Headset’s business intelligence software. Headset’s data is very reliable, as it comes digitally direct from our partner retailers. However, the potential does exist for misreporting in the instance of duplicates, incorrectly classified products, inaccurate entry of products into point-of-sale systems, or even simple human error at the point of purchase. Thus, there is a slight margin of error to consider. Brands listed on this page are ranked in the top twenty within the market and product category by total retail sales volume.

