.svg)
Aug-2026
Sales
Trend
6-Month
Product Count
SKUs
Avg Price
YoY Sales Change
YoY Price Change


Where to Buy
Magic is stocked at 66 licensed dispensaries across Michigan, with the deepest coverage in Detroit, New Buffalo, Coldwater, Flint, and Adrian. Search by ZIP code or city below to find the closest one, or filter by product type if you are after a specific format.
Market Insights Snapshot
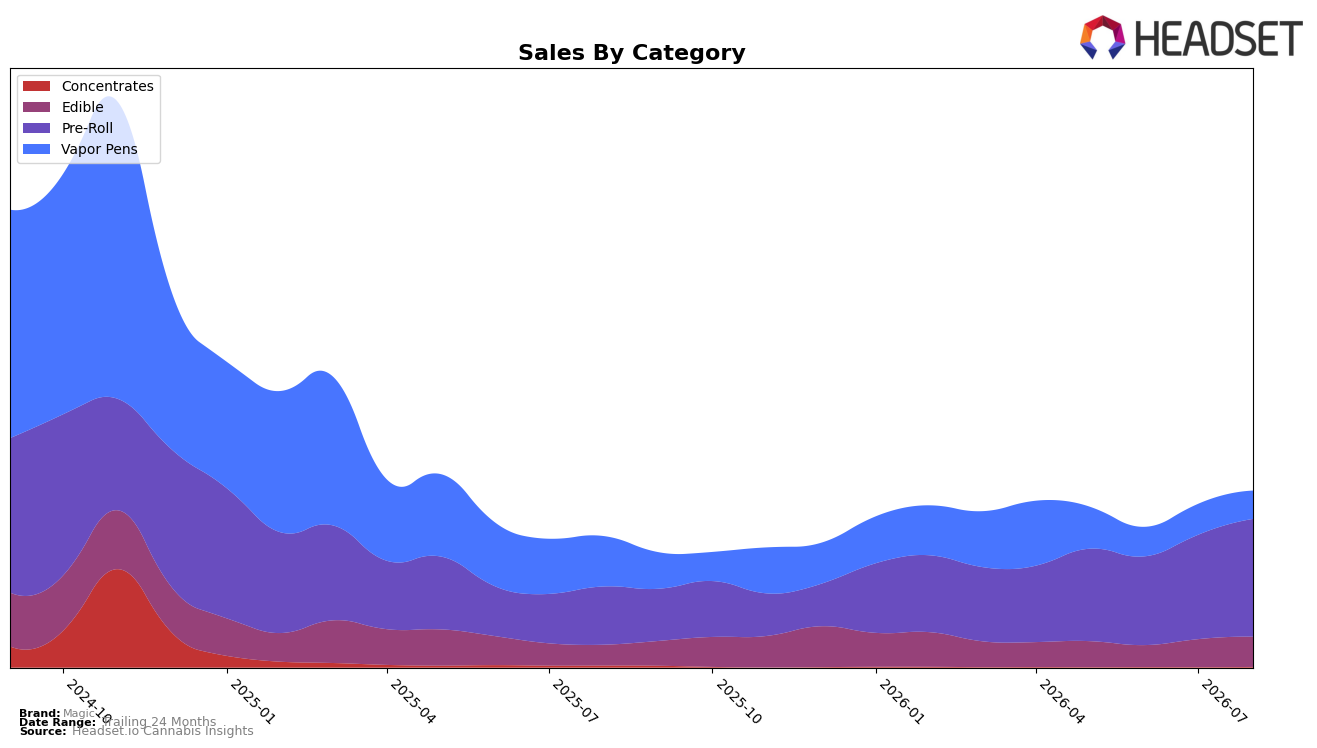
Magic’s category mix in August 2026 concentrated heavily in Pre-Roll at 66.33% share with 101.94% YoY growth and 12.90% MoM, while Edible held 17.10% share with 44.42% YoY and 8.09% MoM. Vapor Pens contracted to 16.04% share with -43.55% YoY and -8.38% MoM, as Concentrates stayed niche at 0.53% share but rebounded 22.58% MoM despite -59.06% YoY. With brand-level sales up 34.40% YoY but down 70.85% versus 24 months, the tilt toward Pre-Roll and Edible at lower average prices ($1.49 in Pre-Roll; $2.33 in Edible) aligns with the brand’s overall 28.68% YoY price drop, implying a volume-led recovery anchored in value formats.
These shifts point to a repositioning toward accessible, high-velocity segments, as the 12.90% MoM lift in a 66.33% Pre-Roll base compounds faster than the -8.38% MoM drag in a 16.04% Vapor Pens base, and the 44.42% YoY in Edible stabilizes mix breadth at 17.10%. The August 2026 Pre-Roll rank of 43 in Michigan, paired with 101.94% YoY growth in that category and a $1.49 average price, indicates a trade-down lane where price elasticity converts share more efficiently than in higher-ticket Vapor Pens at $4.06, implying Magic’s near-term positioning favors scale in value-led Pre-Rolls with Edibles as a secondary growth hedge.
Competitive Landscape
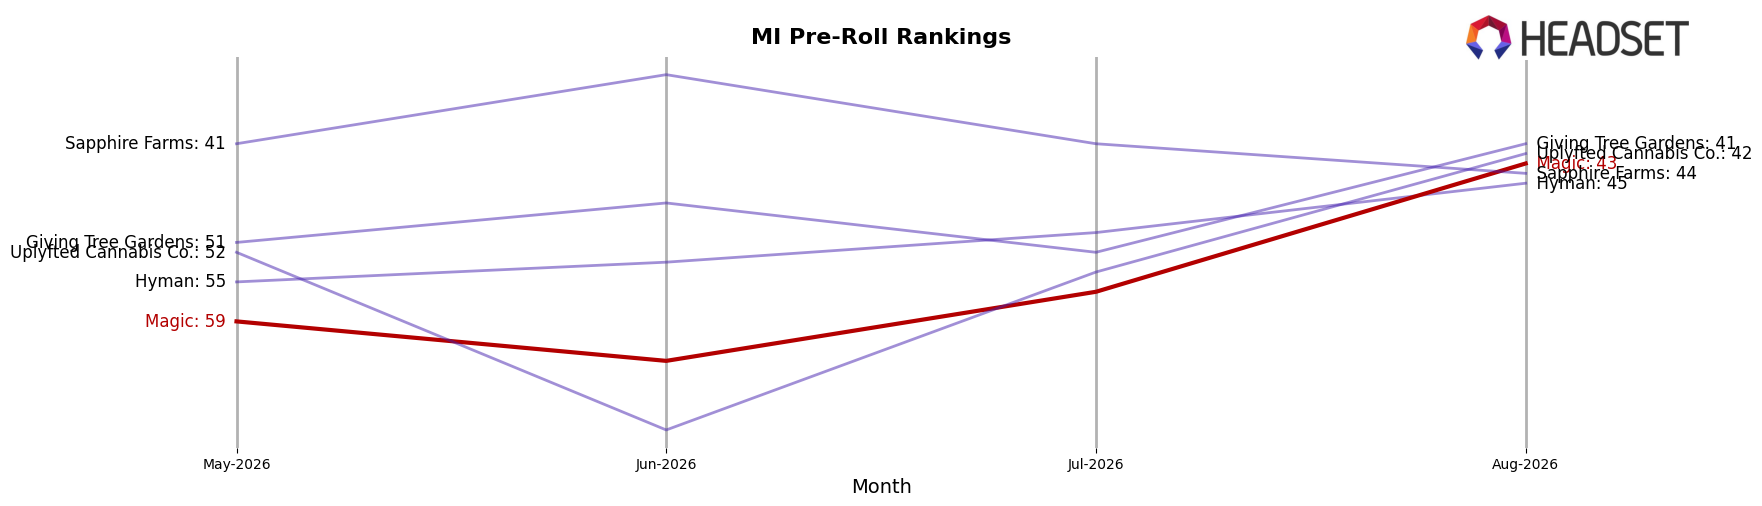
Magic sits at rank #43 in MI Pre-Roll in August 2026, improving 42 positions year over year from #85, and tightening 16 spots versus May 2026’s #59, while still trailing its peak rank of #17 from August 2024 by 26 places; by contrast, Jeeter held at #1 year over year with a 3.1% sales lift and Pro Gro advanced from #9 to #4 alongside a 78.0% YoY sales increase, indicating that Magic’s climb is occurring amid leaders consolidating at the top. The combined signal of a 42-rank YoY rebound and a 16-rank improvement over the last three months implies a recovery phase for Magic that is closing the gap to mid-tier competitors but still requires sustained velocity to break back toward the top-20 ceiling last reached in August 2024.
Notable Products
Cherry Burst Infused Pre-Roll (1.2g) posted the standout movement in August 2026 with a +29.5% MoM lift while holding rank 3, contrasted by Bomb Pop OG Infused Pre-Roll (1.2g) sliding -5.5% at rank 7. Rainbow Z Infused Pre-Roll (1.2g) remained at rank 1 with a +5.6% gain as Blueberry Kush Infused Pre-Roll (1.2g) advanced +19.7% at rank 2, indicating momentum concentrated at the very top of the chart. Eight of the top ten SKUs are in the Infused Pre-Roll family, and Sour Tropicana Infused Pre-Roll (1.2g) dipped -4.5% at rank 4 while Apples & Bananas Infused Pre-Roll (1.2g) jumped +26.8% at rank 8, signaling a portfolio skew toward higher-potency formats with selective churn in the mid-pack. The pattern implies Magic is consolidating leadership around a few fast-accelerating infused SKUs while tolerating modest declines in secondary variants to keep share anchored at ranks 1–3.
Top Selling Cannabis Brands






Data for this report comes from real-time sales reporting by participating cannabis retailers via their point-of-sale systems, which are linked up with Headset’s business intelligence software. Headset’s data is very reliable, as it comes digitally direct from our partner retailers. However, the potential does exist for misreporting in the instance of duplicates, incorrectly classified products, inaccurate entry of products into point-of-sale systems, or even simple human error at the point of purchase. Thus, there is a slight margin of error to consider. Brands listed on this page are ranked in the top twenty within the market and product category by total retail sales volume.

