May-2026
Sales
Trend
6-Month
Product Count
SKUs
Avg Price
YoY Sales Change
YoY Price Change
Market Insights Snapshot
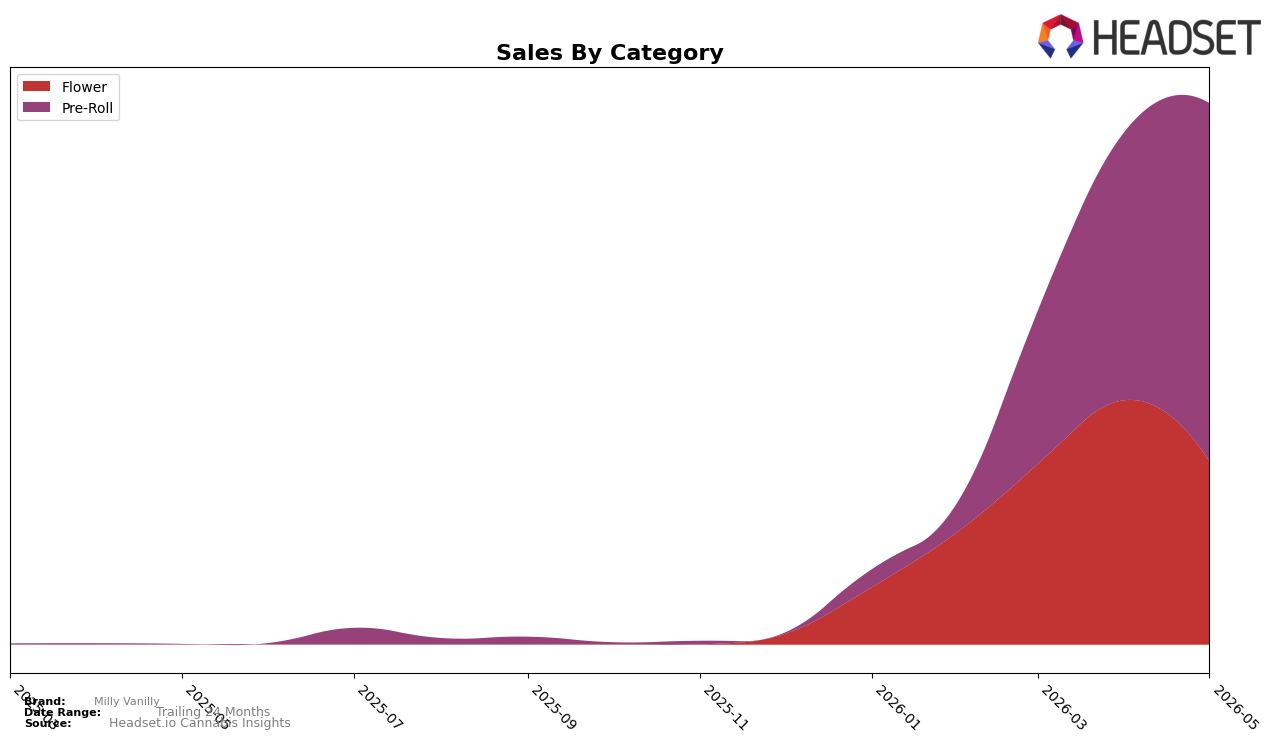
In May 2026, Milly Vanilly concentrated 66.19% of sales in Pre-Roll with a 33.24% month-over-month lift, while Flower held 33.81% share with a -25.13% month-over-month decline; that mix shift coincided with a 259,453.64% year-over-year surge in Pre-Roll versus an undefined year-over-year read in Flower, and an overall average price that was 66.15% higher year over year. The category tilt toward lower-priced Pre-Roll (average price 11.56) versus higher-priced Flower (average price 33.90) helped expand reach despite a mixed pricing environment, implying that volume-led growth in Pre-Roll, not premium mix in Flower, is the dominant driver of May 2026 performance.
With Pre-Roll momentum and a ranked position of 16 in Saskatchewan for Pre-Roll, the brand’s current configuration favors scale categories where share can be compounded faster than in premium-priced Flower; the 33.24% month-over-month gain in Pre-Roll alongside a -25.13% month-over-month contraction in Flower indicates resource allocation toward Pre-Roll can lift rank efficiency without requiring higher average price. Given the 66.19% sales share from Pre-Roll and a 66.15% year-over-year increase in average price across the portfolio, the positioning implication is to defend the value-accessible Pre-Roll price point to sustain velocity while using Flower selectively as a margin hedge rather than a growth anchor.
Competitive Landscape
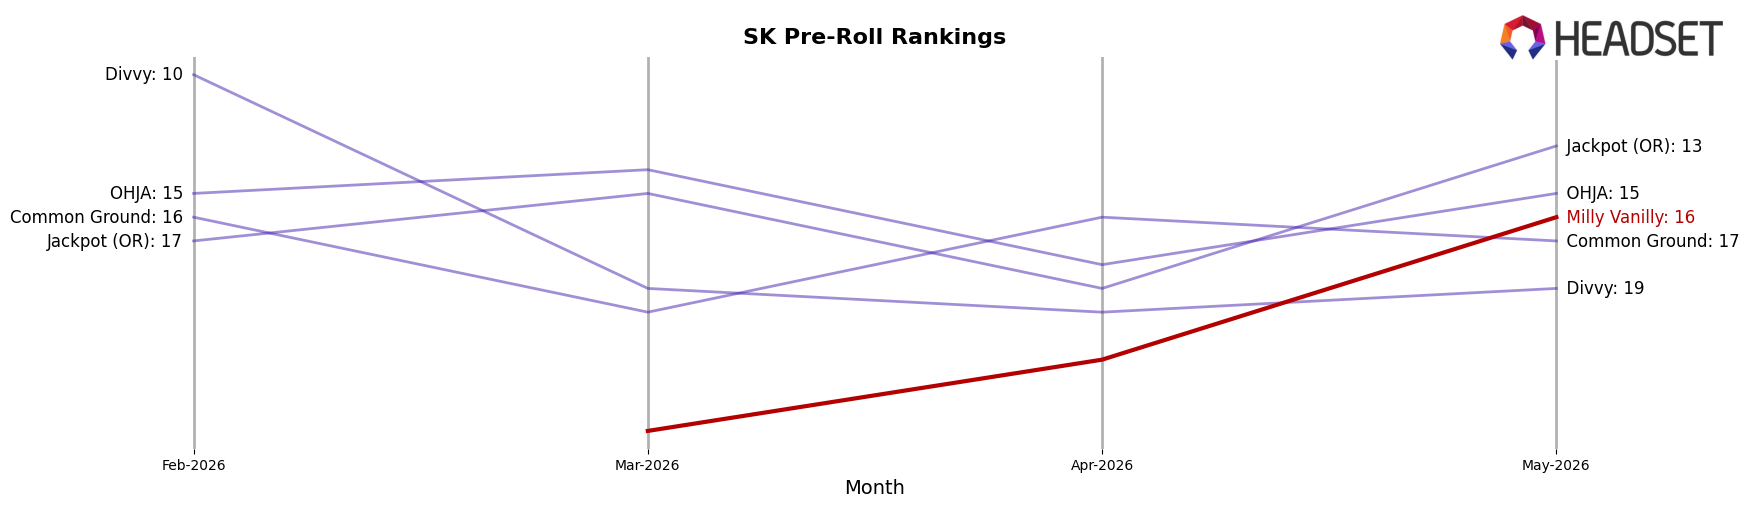
Milly Vanilly sits at #16 in SK Pre-Roll for May 2026, a climb of 69 positions from #85 in February 2026 and matching its peak rank of #16, while the absence of a year-over-year rank signals a newer or re-entered placement rather than a shift from a prior May baseline; by contrast, Back Forty / Back 40 Cannabis held #1 with a year-over-year hold at #1 and 114.9% sales growth, and Bold moved from #4 to #2 alongside 193.3% growth, indicating that Milly Vanilly’s rapid three-month ascent outpaced its own historical standing but still trails competitors that converted high double- to triple-digit growth into top-5 stability—implying the brand’s rank trajectory is momentum-driven and contingent on sustaining share gains against incumbents with persistent top-tier positions.
Notable Products
Soft Serve Pre-Roll 5-Pack (2.5g) posted the largest movement with +217.9% month over month and reached rank 1, while Inda Couch Pre-Roll 10-Pack (5g) fell -24.7% to rank 4. Inda Couch Pre-Roll 5-Pack (2.5g) also accelerated at +144.5% and landed at rank 3, whereas Inda Couch Pre-Roll 2-Pack (1g) contracted -67.0% at rank 8. With six of the top ten in Pre-Roll and only one raw-dollar outlier near $37,467, the mix points to a pivot toward multipack Pre-Rolls driving rank consolidation at the top despite volatility in smaller formats.
Top Selling Cannabis Brands
Data for this report comes from real-time sales reporting by participating cannabis retailers via their point-of-sale systems, which are linked up with Headset’s business intelligence software. Headset’s data is very reliable, as it comes digitally direct from our partner retailers. However, the potential does exist for misreporting in the instance of duplicates, incorrectly classified products, inaccurate entry of products into point-of-sale systems, or even simple human error at the point of purchase. Thus, there is a slight margin of error to consider. Brands listed on this page are ranked in the top twenty within the market and product category by total retail sales volume.

