.svg)

Aug-2026
Sales
Trend
6-Month
Product Count
SKUs
Avg Price
YoY Sales Change
YoY Price Change


Market Insights Snapshot
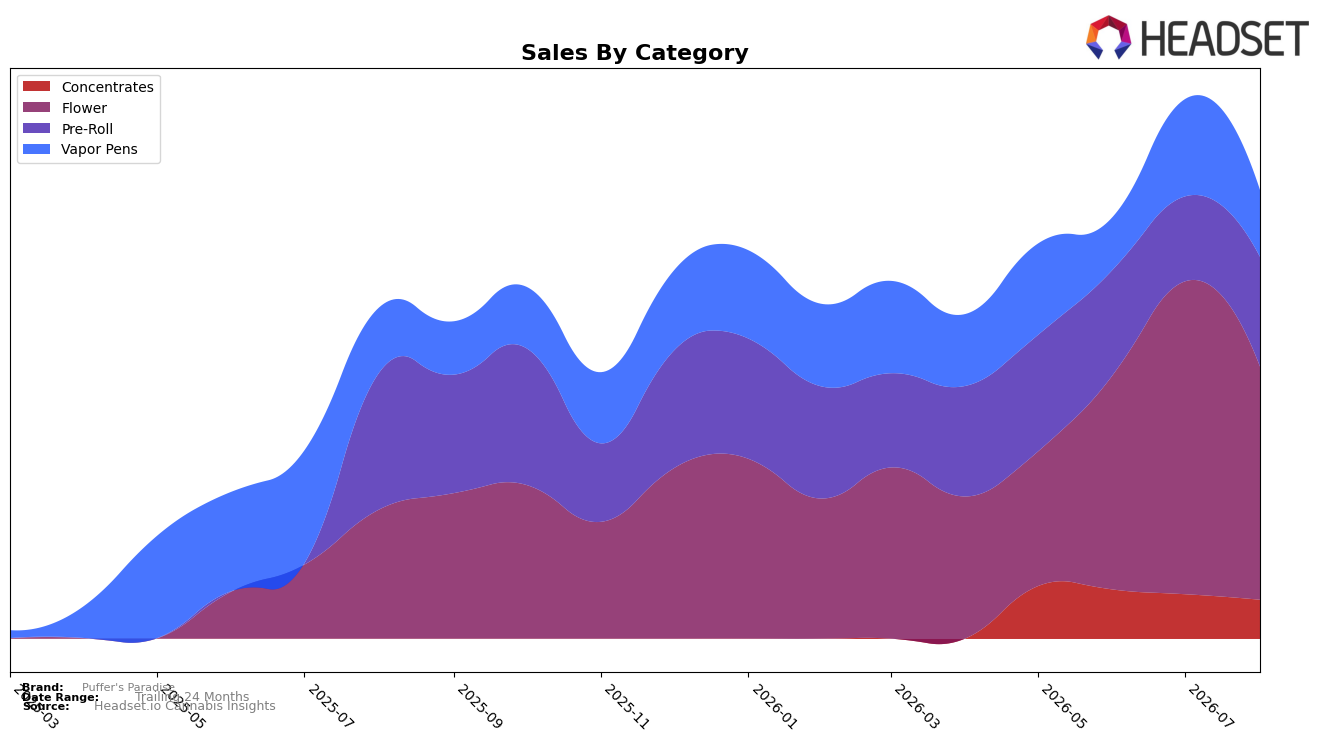
In August 2026, Puffer's Paradise tilted heavily toward Flower at 51.99% share, up 80.66% year over year but down 25.53% month over month, while Pre-Roll held 24.45% share with a 19.88% YoY decline and a 29.34% MoM rise. Vapor Pens accounted for 14.87% share with a 2.60% YoY lift but a 31.40% MoM drop, and Concentrates at 8.69% share fell 12.41% MoM with no YoY read. Average price moved down 2.03% YoY to $19.60 as Flower’s volume expanded into August 2026 despite the MoM pullback, implying a rebalancing toward value and bulk purchasing even as the brand rose to rank 29 in Flower in Alberta.
The mix shift—Flower scaling 80.66% YoY while Pre-Roll contracted 19.88% YoY and Vapor Pens grew only 2.60% YoY—implies a positioning anchored in inhalable value that prioritizes Flower-led basket building over premium format upsell. The contrasting MoM moves (Flower down 25.53% and Vapor Pens down 31.40% versus Pre-Roll up 29.34%) suggest promotional or supply timing that funnels demand between quick-turn Pre-Rolls and core Flower, indicating that August 2026 momentum relies on managing trade-offs between depth in Flower and incremental reach via Pre-Rolls.
Competitive Landscape
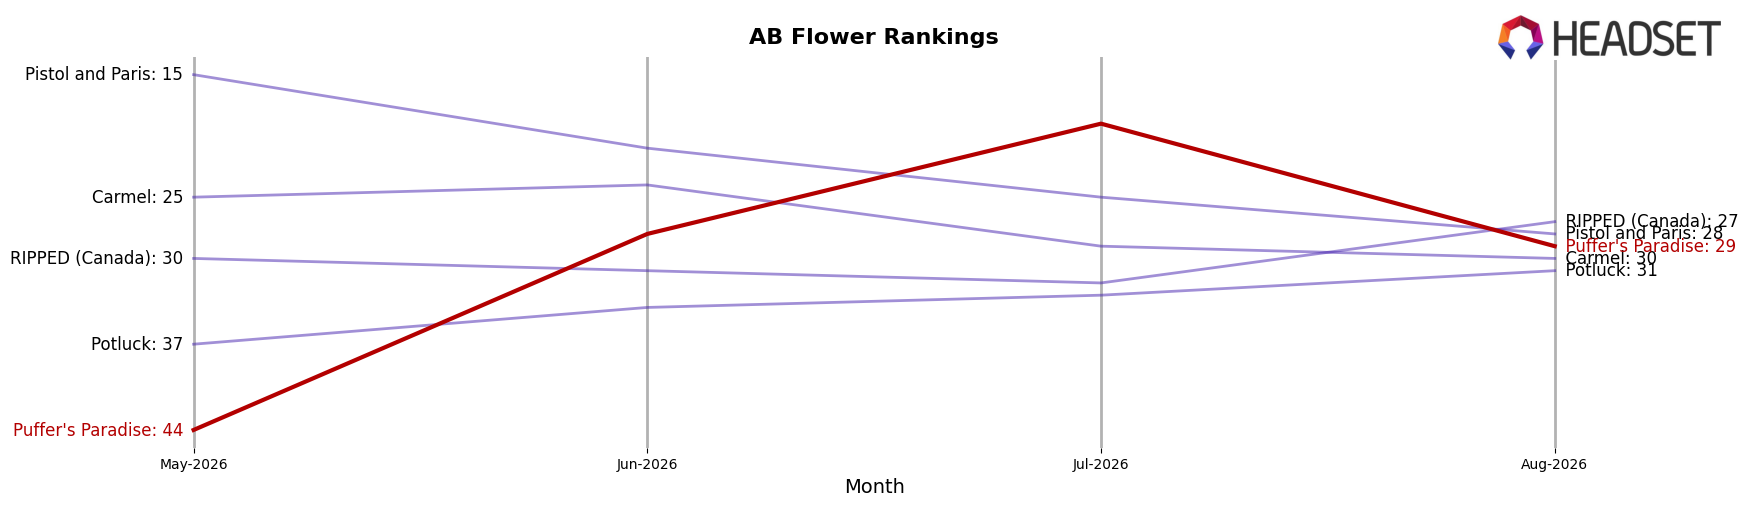
Puffer's Paradise is ranked #29 in AB Flower in August 2026, improving 19 positions year over year from #48 and rising 15 ranks since May 2026, while its peak of #19 in July 2026 was 10 spots higher than today; meanwhile, FIGR moved from #10 to #1 with 182.39% YoY sales growth and Spinach climbed from #5 to #2 with 17.55% YoY growth, indicating that Puffer's Paradise’s mid-summer spike followed by a 10-rank pullback points to episodic gains rather than sustained share capture.
Notable Products
Honah Lee Haze Pre-Roll (0.5g) delivered the month’s breakout, up 104.4% MoM to rank 2, while Magik Dragon Pre-Roll (0.5g) slid 23.9% MoM to rank 5. Two other notable shifts anchor the ladder: Magik Dragon (7g) climbed 29.9% MoM to rank 4 and Magik Dragon Pre-Roll 3-Pack (1.5g) rose 22.7% MoM to hold rank 1. With six of the top ten being Pre-Roll SKUs, the mix points to Puffer's Paradise leaning into multipack and value-oriented inhalables as the primary acquisition and repeat-purchase engine.
Top Selling Cannabis Brands






Data for this report comes from real-time sales reporting by participating cannabis retailers via their point-of-sale systems, which are linked up with Headset’s business intelligence software. Headset’s data is very reliable, as it comes digitally direct from our partner retailers. However, the potential does exist for misreporting in the instance of duplicates, incorrectly classified products, inaccurate entry of products into point-of-sale systems, or even simple human error at the point of purchase. Thus, there is a slight margin of error to consider. Brands listed on this page are ranked in the top twenty within the market and product category by total retail sales volume.

