Apr-2026
Sales
Trend
6-Month
Product Count
SKUs
Avg Price
YoY Sales Change
YoY Price Change
Market Insights Snapshot
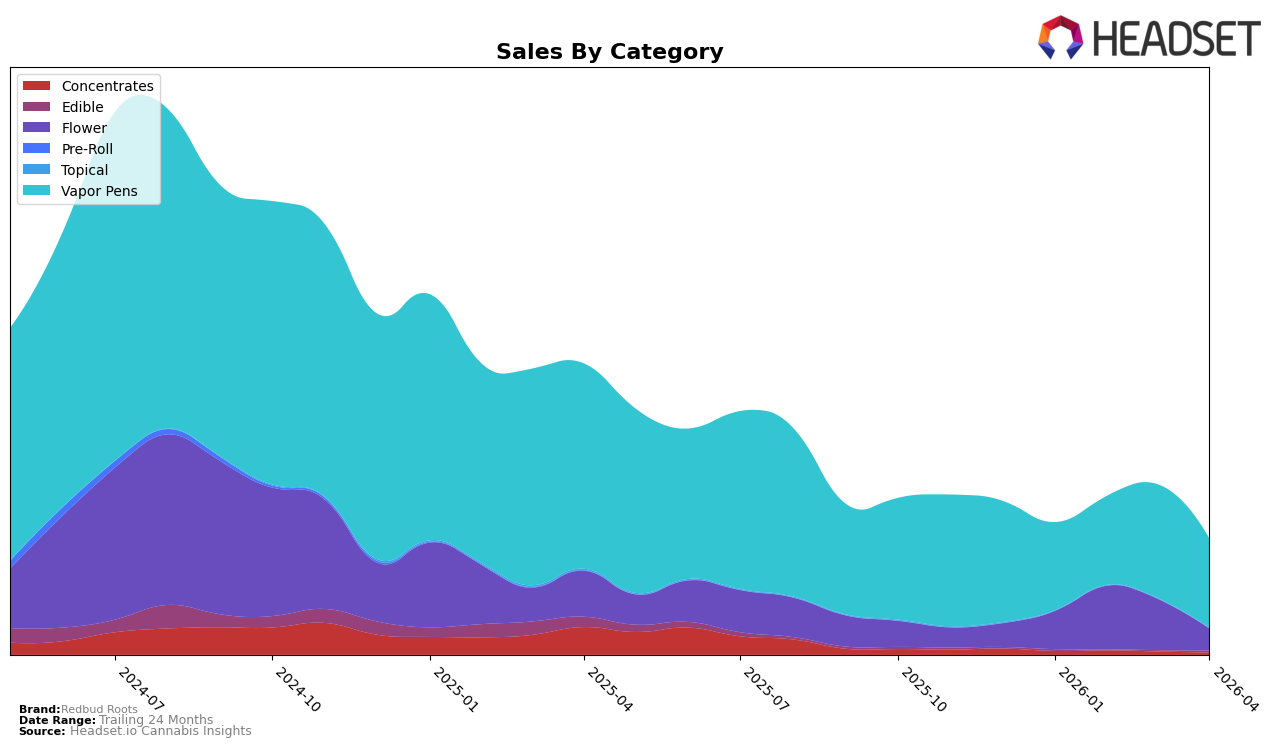
In Illinois, Redbud Roots has shown fluctuating performance in the Vapor Pens category. Notably, the brand was not in the top 30 in January and February 2026, ranking 35th and 38th, respectively. However, March 2026 saw a significant improvement with a jump to the 31st position, although this was followed by a decline to 39th in April. This volatility suggests challenges in maintaining consistent market share in Illinois, despite a notable sales increase in March. The brand's ability to briefly break into the top 30 indicates potential, but sustaining that position remains elusive.
In Michigan, Redbud Roots has had a mixed performance across categories. In the Flower category, it did not make the top 30 rankings from January through April 2026, suggesting a need for strategic adjustments to gain traction. In contrast, the Vapor Pens category in Michigan shows more promise, with rankings consistently in the mid-30s, peaking at 36th in February and March before a slight dip in April. This steady presence indicates a stronger foothold in this category compared to others. Meanwhile, in Ohio, the brand has been slowly climbing the ranks in Vapor Pens, moving from 76th in January to 67th in April, reflecting gradual but positive momentum.
Competitive Landscape
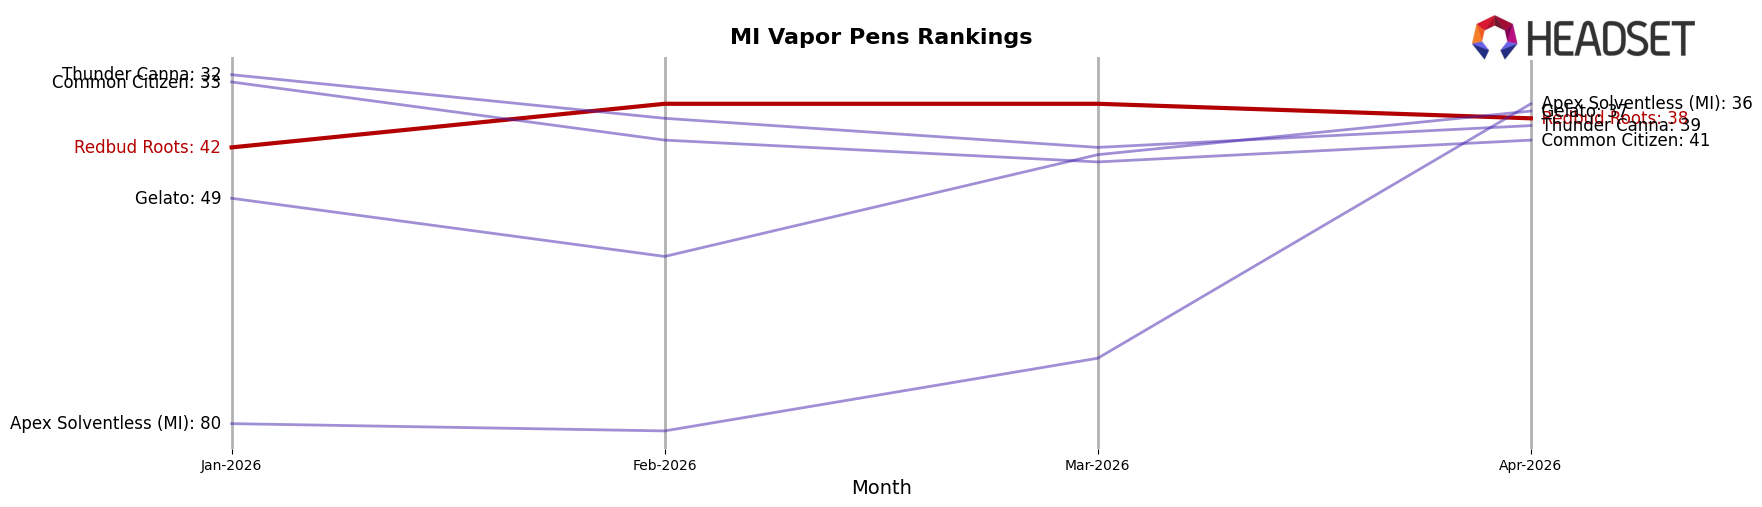
In the competitive landscape of vapor pens in Michigan, Redbud Roots has shown a fluctuating performance in the first quarter of 2026, with its rank improving from 42nd in January to 36th in both February and March, before slightly declining to 38th in April. This indicates a positive trend in the early months, although the slight drop in April suggests a need for strategic adjustments. Notably, Thunder Canna consistently outperformed Redbud Roots, maintaining a higher rank throughout the period, despite experiencing its own fluctuations. Meanwhile, Common Citizen and Gelato have shown varying performances, with Gelato making a significant leap from 57th in February to 37th in April, surpassing Redbud Roots in the latter month. Interestingly, Apex Solventless (MI) made a remarkable jump from 81st in February to 36th in April, matching Redbud Roots' March rank. These dynamics highlight the competitive pressure in the Michigan vapor pens market, suggesting that Redbud Roots may need to innovate or enhance its marketing strategies to maintain and improve its position amidst strong competitors.
Notable Products
In April 2026, Redbud Roots saw Red Nerdz (Bulk) climb to the top position in the Flower category, with a notable sales figure of 3,847 units, marking a significant recovery from its fifth place in March. Whompz (Bulk) also performed impressively, securing the second spot, improving from its previous fifth place ranking. Oops All Berries (Bulk) re-entered the rankings at third position, demonstrating a strong comeback in the Flower category. Mango Puff HTFSE Distillate Cartridge (1g) emerged in the Vapor Pens category, debuting at fourth place, while Forbidden Fruit Full Spectrum Cartridge (1g) followed closely behind in fifth. These shifts indicate a dynamic change in consumer preferences, with notable gains in sales for both Flower and Vapor Pens categories.
Top Selling Cannabis Brands
Data for this report comes from real-time sales reporting by participating cannabis retailers via their point-of-sale systems, which are linked up with Headset’s business intelligence software. Headset’s data is very reliable, as it comes digitally direct from our partner retailers. However, the potential does exist for misreporting in the instance of duplicates, incorrectly classified products, inaccurate entry of products into point-of-sale systems, or even simple human error at the point of purchase. Thus, there is a slight margin of error to consider. Brands listed on this page are ranked in the top twenty within the market and product category by total retail sales volume.

