.svg)
Sep-2026
Sales
Trend
6-Month
Product Count
SKUs
Avg Price
YoY Sales Change
YoY Price Change


Where to Buy
Rogue Green is stocked at 67 licensed dispensaries across Missouri, with the deepest coverage in St. Louis, Kansas City, Springfield, Cape Girardeau, and Independence. Search by ZIP code or city below to find the closest one, or filter by product type if you are after a specific format.
Market Insights Snapshot
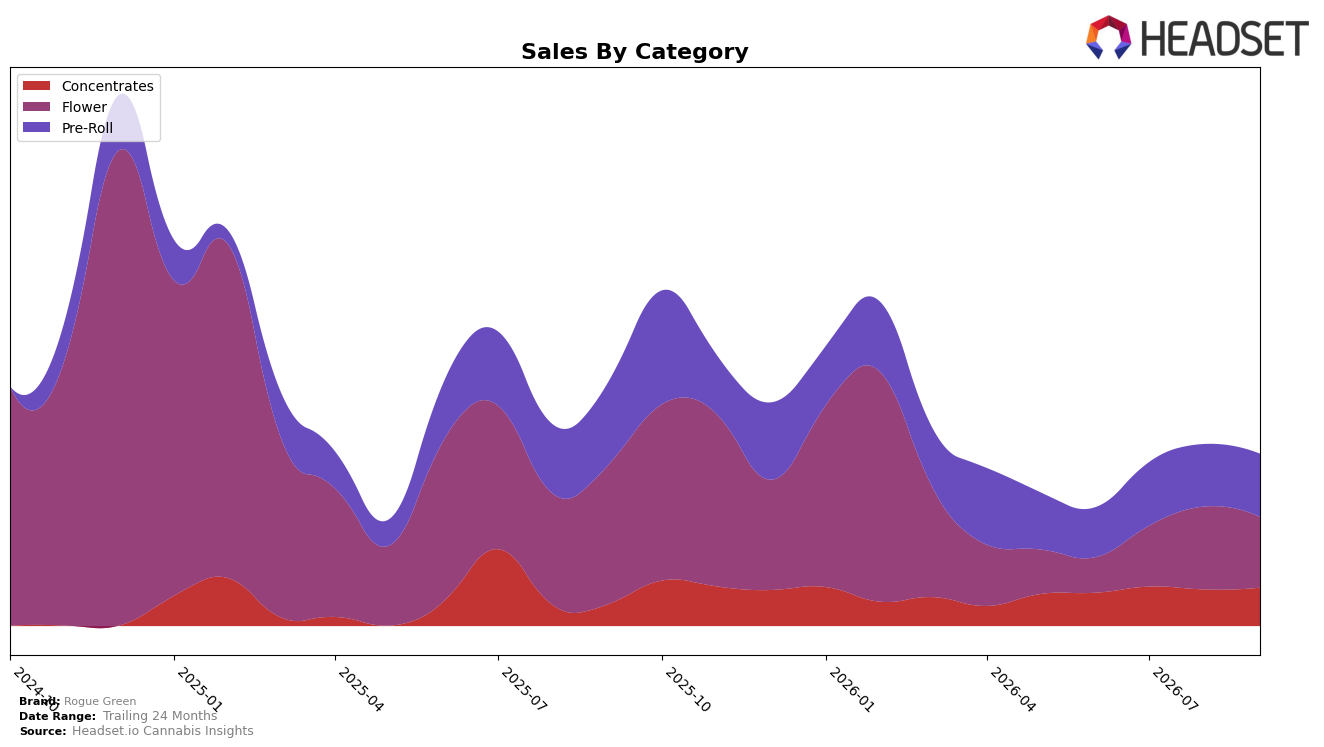
Rogue Green’s category mix in September 2026 shows Flower at 41.07% share with a year-over-year decline of 49.34% and a month-over-month decline of 14.83%, while Pre-Roll holds 36.73% share with a 23.91% year-over-year drop but a 1.19% month-over-month gain; Concentrates account for 22.20% share with a 77.09% year-over-year increase and a 4.95% month-over-month rise. Against a brand-level sales change of -29.52% year over year and a 5.08% year-over-year increase in average price, this mix indicates the historically largest bucket is dragging total performance as Flower underperforms, while Concentrates’ faster growth rate and Pre-Roll’s month-over-month uptick partially offset the decline, implying the brand is pivoting toward higher-growth subsegments to stabilize volumes.
Positioning-wise, the 22.20% share now tied to Concentrates growing 77.09% year over year alongside a 4.95% month-over-month lift suggests traction in a premium-adjacent segment as the brand’s average price rose 5.08% year over year, whereas a 41.07% Flower share with a 14.83% month-over-month contraction and a 49.34% year-over-year drop points to reduced competitiveness in core value-driven baskets. With a 66 rank in Flower in Missouri, the mix shift and month-over-month gains in Pre-Roll at 1.19% imply near-term emphasis should migrate from low-ranked Flower toward SKUs where share expansion is feasible, using Concentrates’ momentum to rebuild velocity while Pre-Roll acts as the volume bridge.
Competitive Landscape
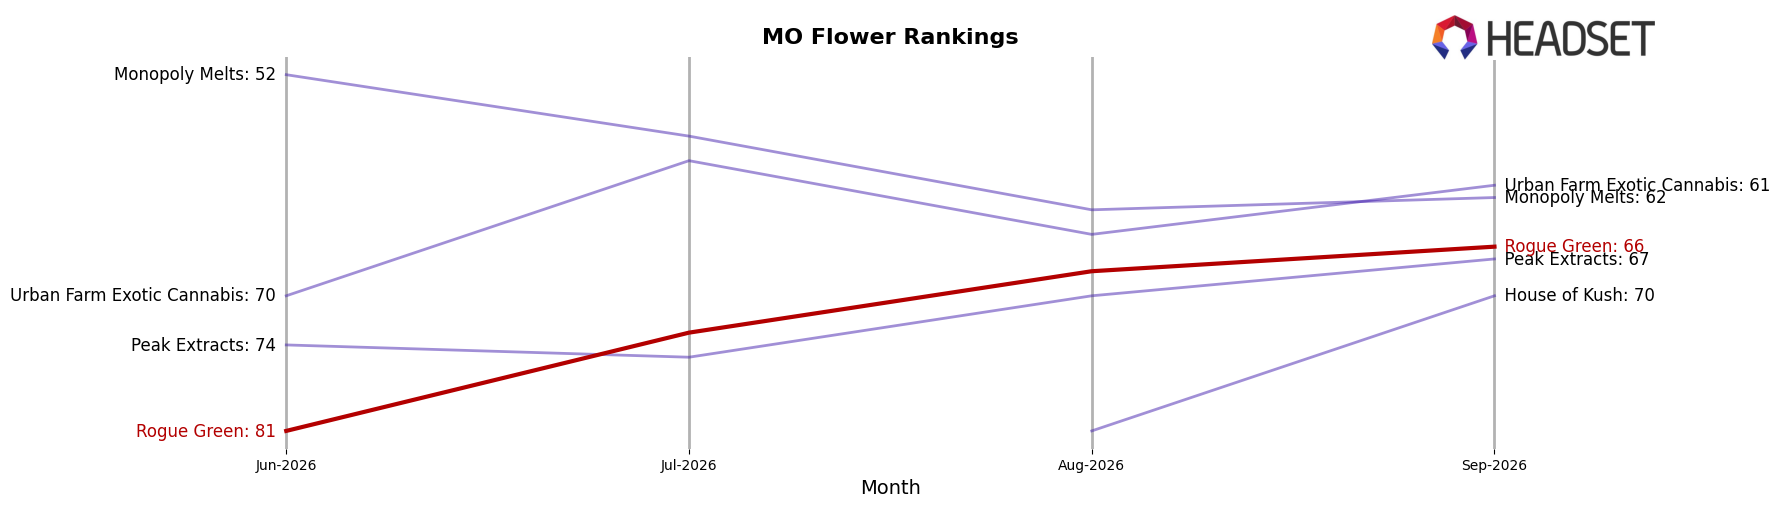
Rogue Green ranks #66 in MO Flower in September 2026, slipping 6 positions year over year from #60 and improving 15 spots versus the prior three months from #81, while the brand’s peak of #40 in December 2024 sits 26 ranks above today. Among leaders, Flora Farms held #1 year over year and remains #1 with a 33.4% YoY sales increase, and Amaze Cannabis climbed from #6 to #2 alongside a 19.8% YoY sales gain; by contrast, Sinse Cannabis stayed at #3 with an 11.1% YoY sales decline. The combination of a 6-rank YoY drop and a 15-rank recovery from the recent trough implies Rogue Green is stabilizing off a lower base, with upside contingent on converting short-term rank momentum into sustained share wins against top-5 incumbents.
Notable Products
Black Runtz Infused Pre-Roll (1g) posted the steepest movement in September 2026 with a -11.4% MoM decline while sitting at rank 10, contrasting with Block Party Infused Pre-Roll (1g) up 39.3% at rank 4; this spread signals a pruning of weaker tail SKUs alongside momentum in mid-pack hitters. Oil Spill (3.5g) held rank 1 with a 3.3% MoM lift while Zoap Moon Rocks (3.5g) at rank 5 jumped 22.3% to $13,250, and these two Flower entries suggest the brand’s anchor demand is consolidating around premium eighths. With five of the top ten coming from Pre-Roll, the category’s breadth is clear even as Zoap Infused Pre-Roll (1g) rose 4.3% at rank 2 and the underperforming Black Runtz creates space for higher-velocity pre-roll formats. The pattern implies Rogue Green is tilting assortment toward Flower-led flagship volume and selectively culling lower-yield Pre-Roll variants to concentrate velocity where rank stability and double-digit lifts persist.
Top Selling Cannabis Brands






Data for this report comes from real-time sales reporting by participating cannabis retailers via their point-of-sale systems, which are linked up with Headset’s business intelligence software. Headset’s data is very reliable, as it comes digitally direct from our partner retailers. However, the potential does exist for misreporting in the instance of duplicates, incorrectly classified products, inaccurate entry of products into point-of-sale systems, or even simple human error at the point of purchase. Thus, there is a slight margin of error to consider. Brands listed on this page are ranked in the top twenty within the market and product category by total retail sales volume.

