.svg)

Aug-2026
Sales
Trend
6-Month
Product Count
SKUs
Avg Price
YoY Sales Change
YoY Price Change


Where to Buy
Royal Cannabis (MO) is stocked at 56 licensed dispensaries across Missouri, with the deepest coverage in St. Louis, Kansas City, Cape Girardeau, Columbia, and Jefferson City. Search by ZIP code or city below to find the closest one, or filter by product type if you are after a specific format.
Market Insights Snapshot
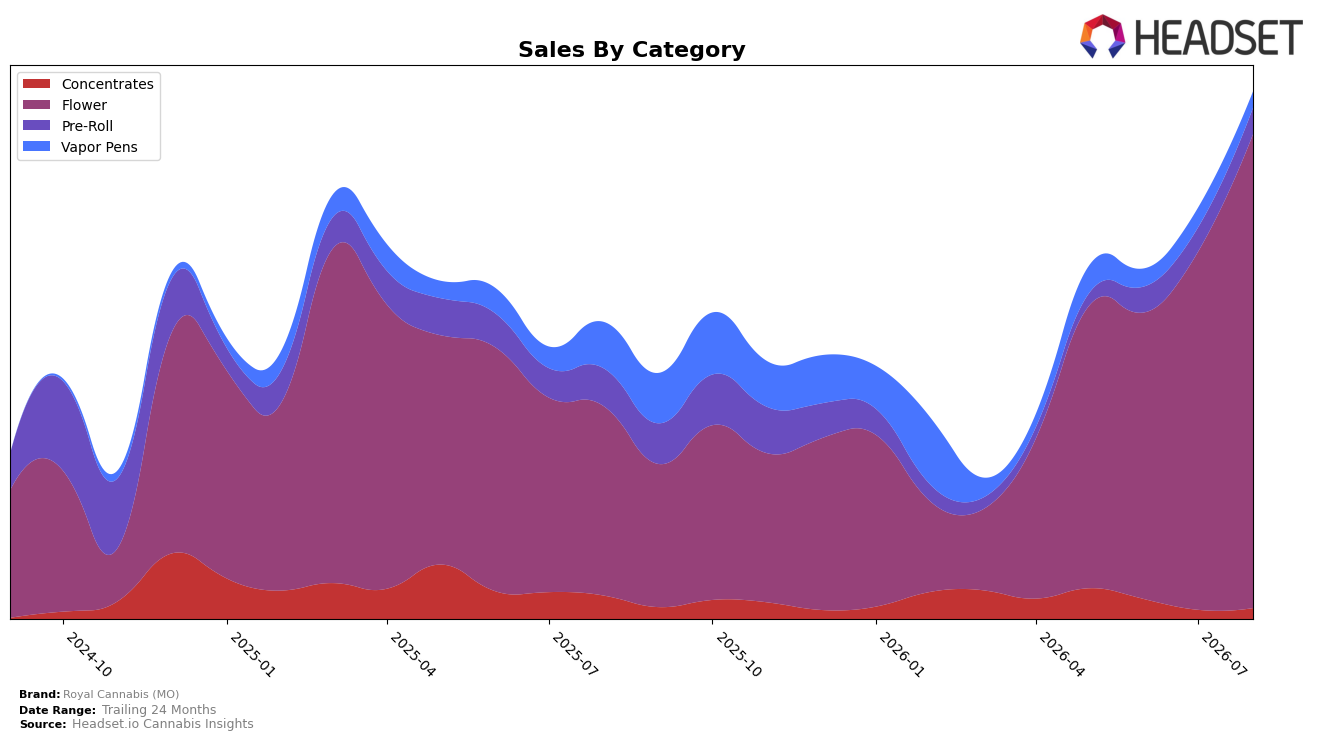
In August 2026, Royal Cannabis (MO) concentrated 89.95% of sales in Flower, where category sales rose 150.79% year over year and 32.45% month over month, while the brand’s average price advanced 7.09% YoY to $28.26. Secondary categories contracted: Vapor Pens fell 65.21% YoY and 17.35% MoM to a 3.05% share, and Concentrates declined 53.42% YoY but rebounded 18.94% MoM to 2.06% share; Pre-Roll held 4.94% share with a 30.55% YoY decline and 9.08% MoM growth. With Flower anchoring performance and ancillary formats shrinking in share, the pattern implies the brand’s near-term growth is tied to sustaining Flower momentum in Missouri, while volatility in smaller categories limits diversification.
Positioning-wise, a 150.79% YoY surge and 32.45% MoM lift in Flower alongside a rank of 34 in Missouri Flower indicates headroom to gain tiers if the brand converts Flower mix (89.95% share) into broader basket penetration. The concurrent 65.21% YoY decline in Vapor Pens and 53.42% YoY decline in Concentrates, despite MoM upticks in two of the three non-Flower formats (18.94% in Concentrates, 9.08% in Pre-Roll), suggests the brand is de-risked by price-accessible Flower but under-indexed in premium or convenience formats; this implies a strategy focused on reinforcing Flower price-value while selectively rebuilding presence in Vapor Pens to hedge against category cyclicality.
Competitive Landscape
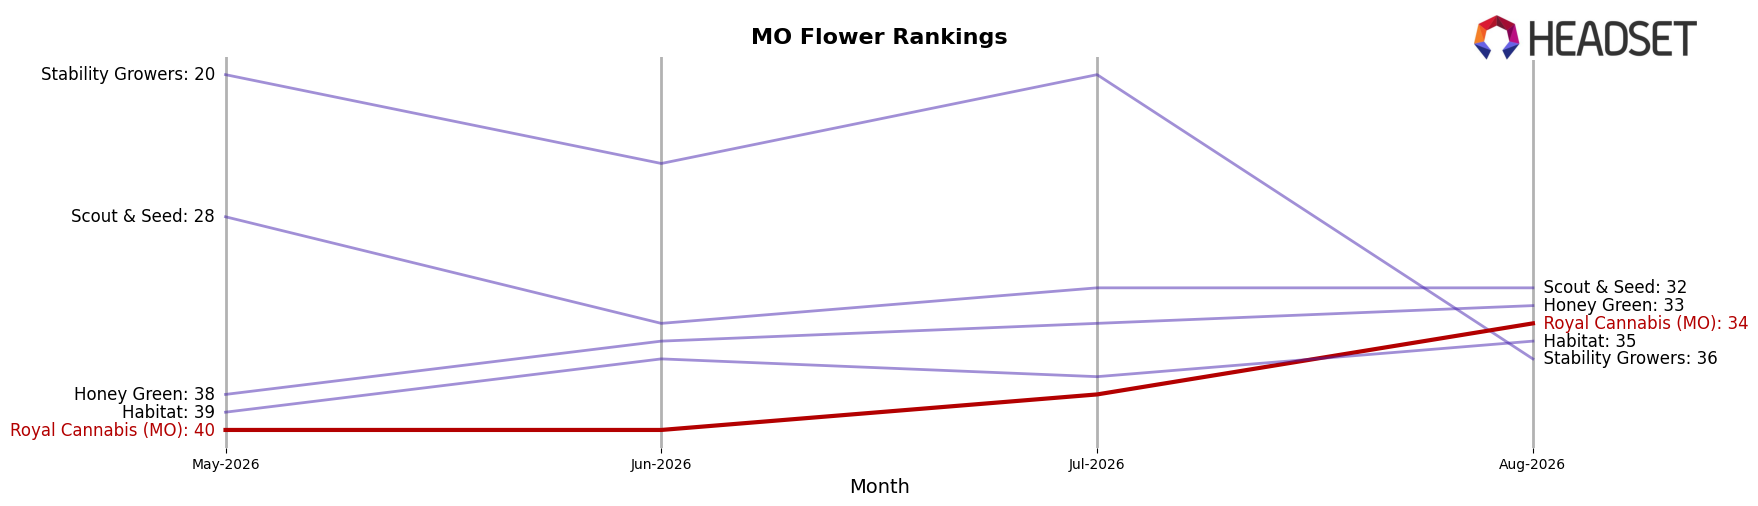
Royal Cannabis (MO) is ranked #34 in MO Flower in August 2026, improving 13 positions from #47 year over year, while also climbing 6 spots from #40 three months ago; this new peak rank of #34 in August 2026 contrasts with Farmer G vaulting from #31 to #5 year over year and Amaze Cannabis advancing from #6 to #4, indicating competitors are accelerating faster up the table. With Flora Farms holding #1 both this year and last year and Illicit / Illicit Gardens improving from #3 to #2 despite a -5.0% sales YoY change, the gap between Royal Cannabis (MO) at #34 and the top tier remains wide; the pattern implies Royal Cannabis (MO)’s upward rank trajectory is positive but incremental, requiring larger step-change gains to convert rank mobility into material share capture against faster-rising peers.
Notable Products
Grape Gasoline (3.5g) delivered the clearest movement with a 63.0% month-over-month increase and climbed into rank 6, while Cap Junky (3.5g) rose 44.4% to rank 3 and GMO Bomb (3.5g) gained 16.7% at rank 2. With four of the top five positions held by Flower SKUs and no Pre-Roll above rank 9, the category tilt is explicit and likely absorbing consumer spend away from smaller formats. Cheetah Piss (3.5g) sits at rank 1 despite no reported MoM, and Moonshot (Bulk) holds rank 8 with a single reported dollar figure of $39,687, pointing to depth across both 3.5g and bulk pack sizes. The pattern implies Royal Cannabis (MO) is consolidating share through Flower-led momentum and format breadth rather than diversifying into Pre-Rolls this month.
Top Selling Cannabis Brands






Data for this report comes from real-time sales reporting by participating cannabis retailers via their point-of-sale systems, which are linked up with Headset’s business intelligence software. Headset’s data is very reliable, as it comes digitally direct from our partner retailers. However, the potential does exist for misreporting in the instance of duplicates, incorrectly classified products, inaccurate entry of products into point-of-sale systems, or even simple human error at the point of purchase. Thus, there is a slight margin of error to consider. Brands listed on this page are ranked in the top twenty within the market and product category by total retail sales volume.

