Jun-2026
Sales
Trend
6-Month
Product Count
SKUs
Avg Price
YoY Sales Change
YoY Price Change
Market Insights Snapshot
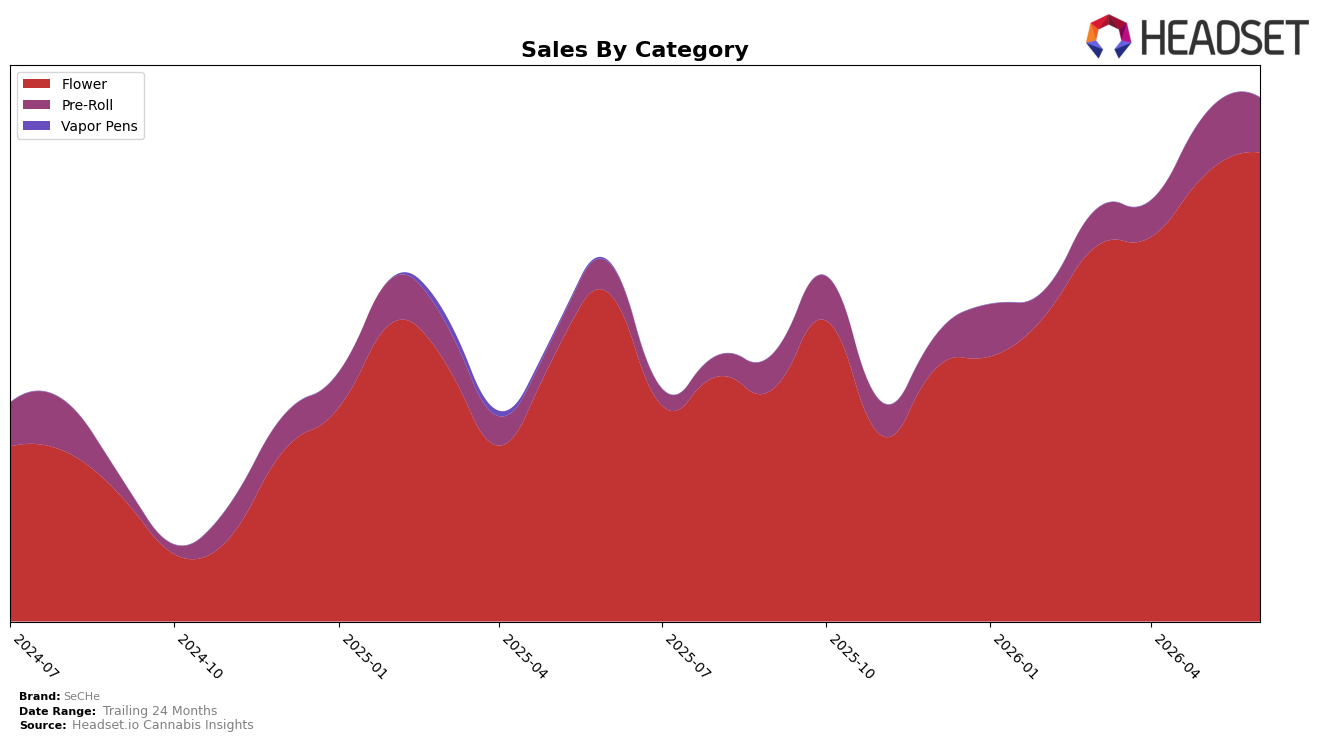
In June 2026, SeCHe concentrated 89.6% share in Flower with 42.7% year-over-year growth and a 5.1% month-over-month increase, while Pre-Roll held 10.4% share with 80.6% year-over-year growth but an 8.7% month-over-month decline; this mix aligns with a 45.4% brand sales YoY rise alongside a 24.8% YoY drop in average price to $26.20. Within Flower, the rank of 18 in Massachusetts against a category growing 42.7% YoY suggests scale is building faster than monthly shifts indicate, and the Pre-Roll pullback MoM despite higher YoY signals episodic rather than compounding momentum; the pattern implies SeCHe is anchoring growth in Flower breadth while accepting volatility in a smaller Pre-Roll base.
The divergence—Flower up 5.1% MoM while Pre-Roll fell 8.7% MoM, paired with a 24.8% YoY price contraction and 45.4% YoY sales expansion—indicates volume-led gains concentrated in a single category, not cross-category lift. Holding 89.6% of sales in Flower with an 18th-place rank in Massachusetts positions SeCHe as a scale player in one lane rather than a portfolio balancer, and the 80.6% YoY growth in the 10.4% share Pre-Roll segment without MoM continuity implies testing rather than durable share capture; the implication is that near-term brand positioning skews toward defending and climbing Flower ranks while using Pre-Roll tactically for incremental reach.
Competitive Landscape
SeCHe sits at rank #18 in MA Flower in June 2026 after a year-over-year climb of 82 positions from #100, and it improved 8 ranks versus March 2026 when it was #26; this marks its peak rank to date at #18 while competitors like Farmer's Cut advanced to #1 from #3 with 32.4% YoY sales growth and Simply Herb held #2 from #1 despite a -1.6% YoY sales change. Against a field where Root & Bloom moved to #5 from #16 with 158.9% YoY growth and High Supply / Supply rose to #4 from #5 with 16.7% YoY growth, SeCHe’s shift from #26 in March 2026 to #18 in June 2026 and from #100 a year ago to #18 indicates a late-breaking momentum that, if sustained, converts recent share gains into a stable mid-tier foothold.

Notable Products
Honey Banana Pre-Roll (1g) led the movement with a -38.6% month-over-month drop while holding rank 1, and Animal Mintz Cake Pre-Roll (1g) fell -18.6% at rank 2, signaling a sharp pullback at the very top. At the same time, Wedding Pie Pre-Roll (1g) rose 11.8% at rank 6, and Guavanade (3.5g) in Flower inched up 3.4% at rank 5, indicating stabilization is coming from mid-pack products rather than the leaders. Four of the top ten are Pre-Roll SKUs concentrated in ranks 1–4 and 6, yet two of those top-4 Pre-Rolls declined while the highest Flower entry advanced, implying mix is tilting toward Flower to offset volatility in flagship Pre-Rolls. The pattern points to a commercial pivot where reliance on hero Pre-Rolls softens and diversified Flower plays provide steadier baseline volume, with a single mid-tier riser absorbing some of the demand slack.
Top Selling Cannabis Brands
Data for this report comes from real-time sales reporting by participating cannabis retailers via their point-of-sale systems, which are linked up with Headset’s business intelligence software. Headset’s data is very reliable, as it comes digitally direct from our partner retailers. However, the potential does exist for misreporting in the instance of duplicates, incorrectly classified products, inaccurate entry of products into point-of-sale systems, or even simple human error at the point of purchase. Thus, there is a slight margin of error to consider. Brands listed on this page are ranked in the top twenty within the market and product category by total retail sales volume.

