Jun-2026
Sales
Trend
6-Month
Product Count
SKUs
Avg Price
YoY Sales Change
YoY Price Change
Market Insights Snapshot
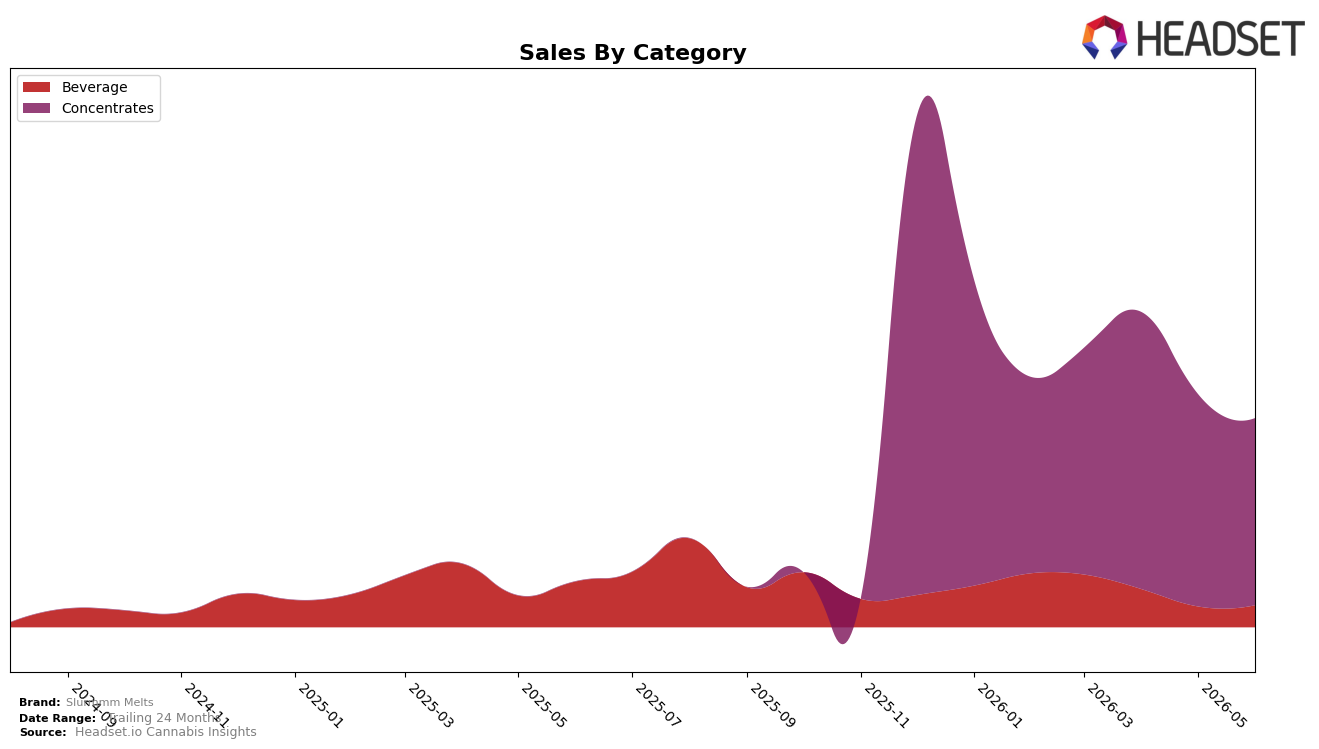
In June 2026, Slurmmm Melts derived 89.58% of sales from Concentrates and 10.42% from Beverage, with Concentrates down 12.03% month over month while Beverage rose 6.05% month over month; year over year, Beverage contracted 52.19% while Concentrates provided the largest share despite no reported year-over-year rate. Average price climbed 278.11% year over year to $40.31, while category mix skewed toward higher-ticket Concentrates at an average price of 68.76, indicating a strategic tilt toward premiumized formats even as short-term MoM softness in Concentrates offsets Beverage’s small-share MoM uptick.
Within Concentrates in British Columbia, Slurmmm Melts ranked 12, a position consistent with a specialist profile where a single category supplies nearly nine-tenths of revenue and month-over-month volatility in that core category (−12.03%) directly dictates overall trajectory. The combination of a 358.80% brand sales year-over-year surge and a 52.19% year-over-year decline in the smaller Beverage line implies that market gains are concentrated in higher-priced formats rather than diversified across value segments, positioning the brand as a premium Concentrates-first player whose near-term ranking headroom depends more on stabilizing core-category momentum than on expanding the subscale Beverage contribution.
Competitive Landscape
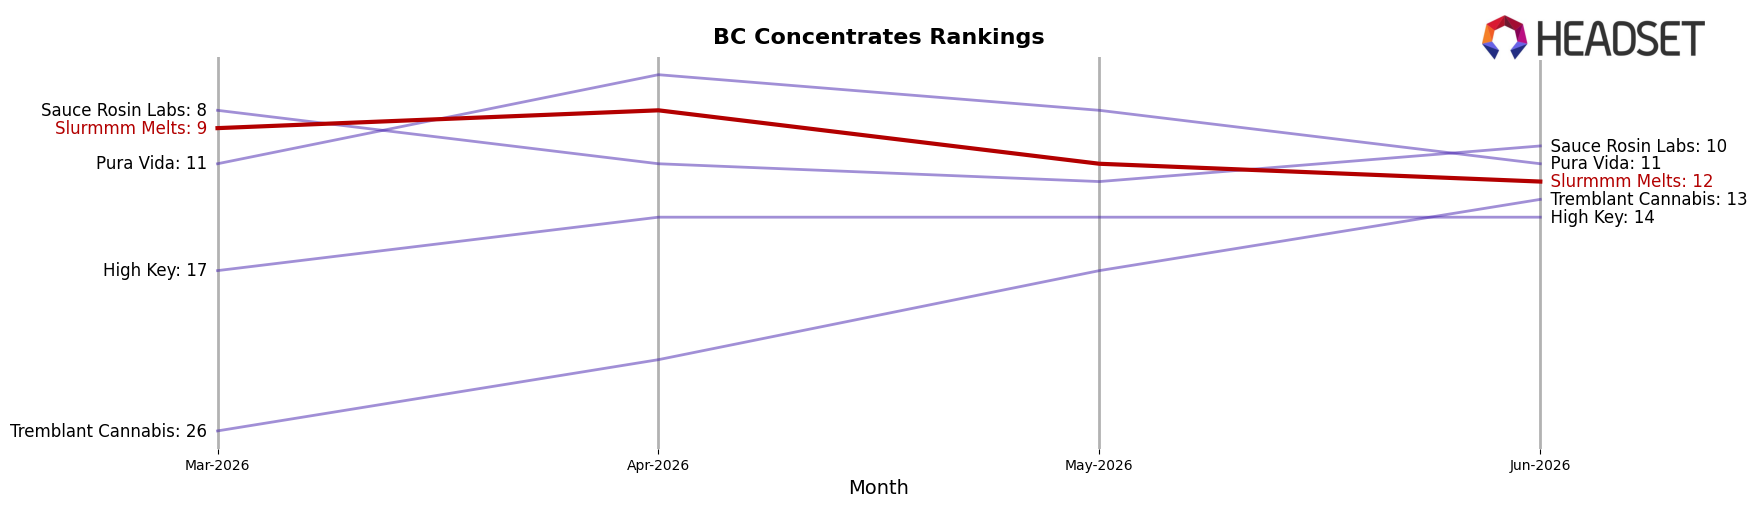
Slurmmm Melts ranks #12 in BC Concentrates in June 2026, slipping 3 positions from #9 in March 2026 and sitting 6 spots below its peak of #6 in December 2025; with no year-over-year rank available, the short-term drop contrasts with BoxHot climbing from #10 to #3 and with Endgame holding #1 while growing sales 13.8% year over year. Compared with Vortex Cannabis Inc. fixed at #2 despite a 38.2% YoY sales decline and Nugz (Canada) jumping from #15 to #5 on 145.2% YoY sales growth, Slurmmm Melts’ 3-rank slide and 6-rank gap from its December 2025 peak indicate lost share of attention within the top tier rather than category contraction.
Notable Products
Berry Fumez Live Rosin (1g) led the notable movement in June 2026 with a 113.45% month-over-month increase and rose into rank 7, while Grape Peel Live Hash Rosin (1g) fell 59.38% to rank 8 and Runtz Live Hash Rosin (1g) declined 76.13% at rank 9. Lemon Royale Live Hash Rosin (1g) also surged 58.15% to rank 4 as Cake Crasher Live Rosin Red Drink (10mg THC, 355ml) advanced 43.45% to rank 1, signaling a split where one beverage climbed even as Lemon Lime Live Rosin Soda (10mg THC, 355ml) dropped 38.03% to rank 3. Eight of the top ten are Concentrates, indicating mix gravity toward hash rosin formats despite volatility within flavor lines, and the single beverage at the top suggests trial-driven peaks rather than category-wide momentum. The pattern implies Slurmmm Melts is consolidating around high-velocity Concentrates while testing beverage spikes for incremental reach, pointing to a portfolio prioritization of resin SKUs with selective beverage bets.
Top Selling Cannabis Brands
Data for this report comes from real-time sales reporting by participating cannabis retailers via their point-of-sale systems, which are linked up with Headset’s business intelligence software. Headset’s data is very reliable, as it comes digitally direct from our partner retailers. However, the potential does exist for misreporting in the instance of duplicates, incorrectly classified products, inaccurate entry of products into point-of-sale systems, or even simple human error at the point of purchase. Thus, there is a slight margin of error to consider. Brands listed on this page are ranked in the top twenty within the market and product category by total retail sales volume.

