Jun-2026
Sales
Trend
6-Month
Product Count
SKUs
Avg Price
YoY Sales Change
YoY Price Change
Market Insights Snapshot
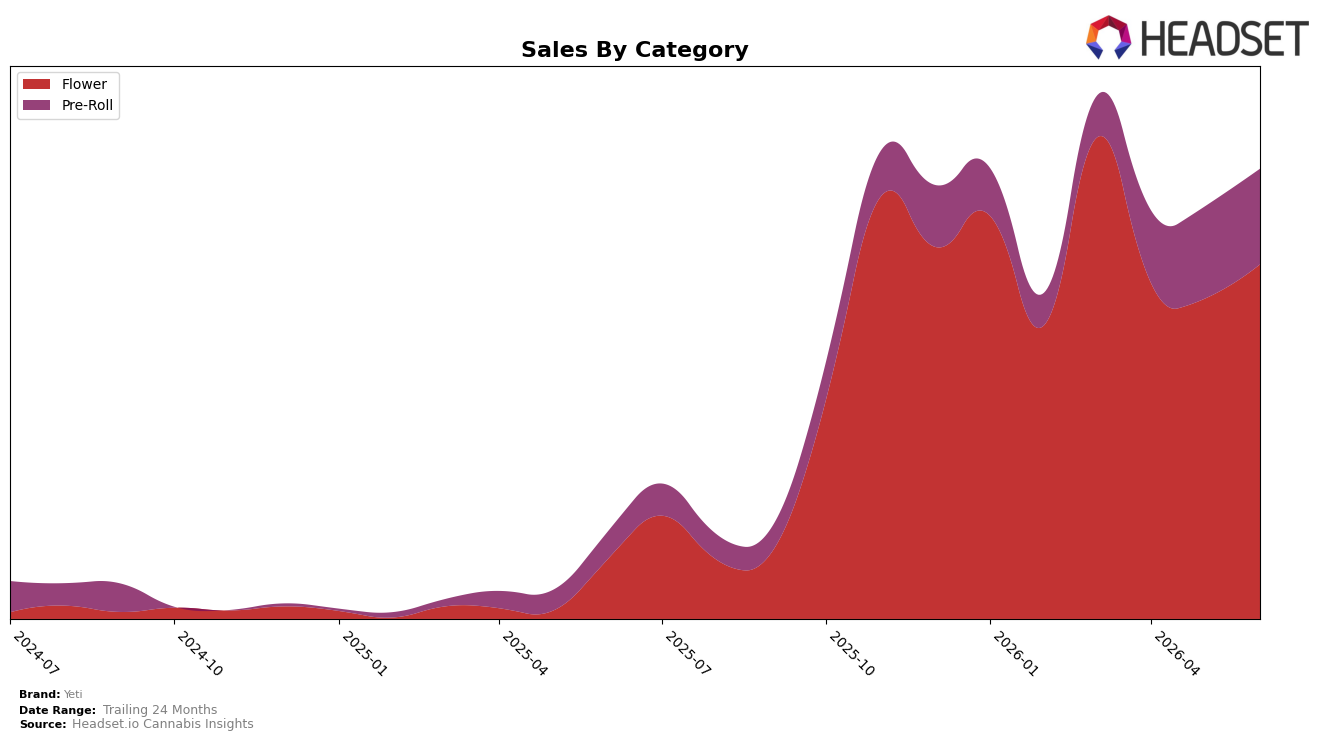
In June 2026, Yeti concentrated 78.81% of sales in Flower and 21.19% in Pre-Roll, with Flower up 491.85% year over year and 10.74% month over month, while Pre-Roll rose 249.57% year over year and 3.77% month over month. The brand’s average price increased 1.01% year over year to $26.34, while Flower’s category-specific price sat higher at $31.93, and Yeti held Flower rank 18 in New Jersey. The pattern implies Yeti is leaning into higher-velocity Flower to compound share gains faster than the 21.19% Pre-Roll base can contribute, prioritizing category depth over breadth.
The mix shift—with Flower growing 242.28 percentage points faster year over year than Pre-Roll (491.85% vs 249.57%) and outpacing it month over month by 6.97 percentage points (10.74% vs 3.77%)—suggests momentum is anchored in core Flower turns rather than price-driven expansion. Holding rank 18 in New Jersey while Flower commands 78.81% share of brand sales indicates headroom to trade up within Flower where price tolerance is higher than the blended average, implying near-term positioning should favor Flower assortment depth and premiumization over reallocating toward Pre-Roll.
Competitive Landscape
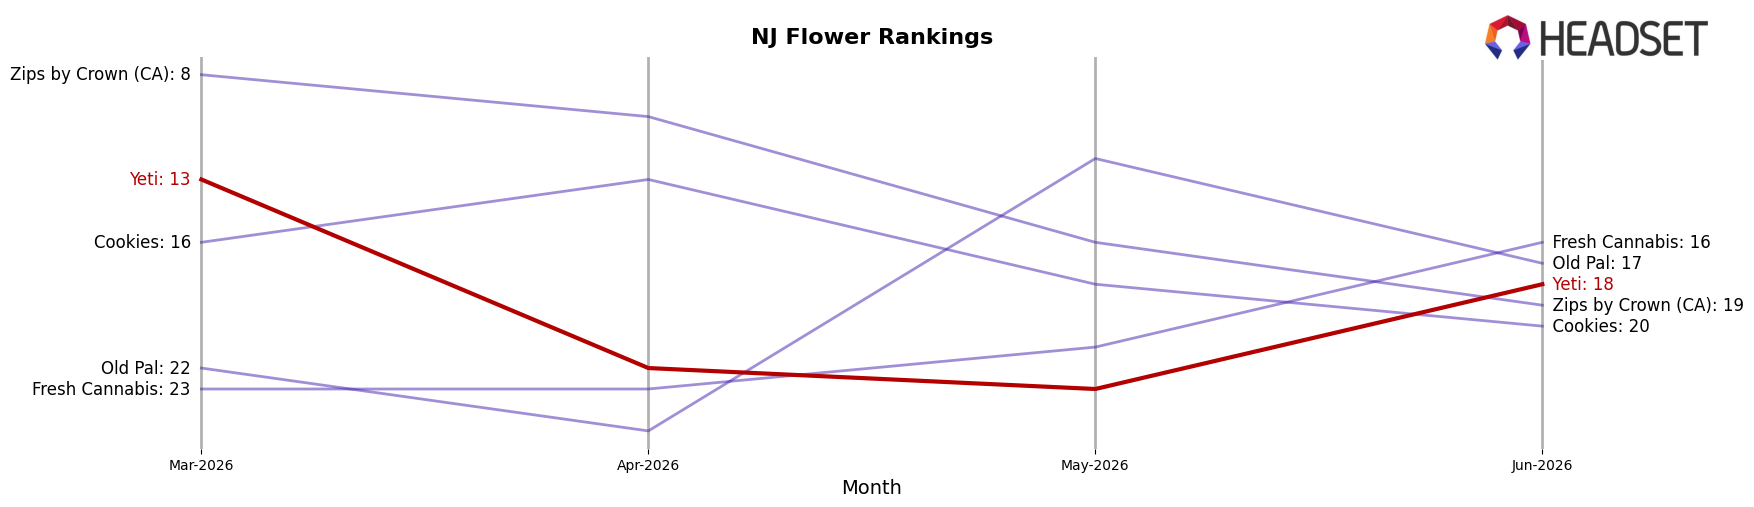
Yeti sits at rank #18 in NJ Flower in June 2026, down 31 positions year over year from #49 and slipping 5 spots since March 2026 when it peaked at #13, indicating a reversal after a short-term climb. Meanwhile, Find. climbed from #12 to #1 with 225.99% YoY sales growth, while Ozone held near the top at #2 despite a 10.61% YoY sales decline, underscoring that rank gains are available even amid mixed sales trends. Compared with the category’s top-five stability—where Good Green advanced from #11 to #3 with 88.63% YoY growth—Yeti’s fall from #13 to #18 over three months points to share being ceded to brands converting YoY momentum into rank, implying that without a near-term velocity lift Yeti’s trajectory will keep drifting away from the top-15 set.
Notable Products
Juicy (3.5g) delivered the standout move in June 2026 with a 142.6% month-over-month surge while climbing to rank 3, outpacing Purple Panties (3.5g) which rose 53.9% to hold rank 1. Four of the top ten are Flower SKUs, with Blue Pineapple (3.5g) at rank 2 and two Pre-Rolls tied at rank 9, and this concentration alongside a -17.4% drop for Lemon Cherry Gelato Pre-Roll (1g) implies Flower is absorbing demand that Pre-Roll is ceding at the bottom of the chart. The -35.5% slide for Cherry Paloma (3.5g) at rank 7 contrasts with steady-to-flat performance near rank 4 for Dante's Inferno (3.5g) at -0.0%, indicating mix rotation within Flower rather than a category-wide pullback. The mix points to a commercial pivot toward a narrower set of high-velocity Flower SKUs driving rank gains while lower-rank Pre-Rolls and underperforming Flower variants are de-emphasized, suggesting assortment pruning and price-pack focus in Flower.
Top Selling Cannabis Brands
Data for this report comes from real-time sales reporting by participating cannabis retailers via their point-of-sale systems, which are linked up with Headset’s business intelligence software. Headset’s data is very reliable, as it comes digitally direct from our partner retailers. However, the potential does exist for misreporting in the instance of duplicates, incorrectly classified products, inaccurate entry of products into point-of-sale systems, or even simple human error at the point of purchase. Thus, there is a slight margin of error to consider. Brands listed on this page are ranked in the top twenty within the market and product category by total retail sales volume.

