Apr-2026
Sales
Trend
6-Month
Product Count
SKUs
Avg Price
YoY Sales Change
YoY Price Change
Market Insights Snapshot
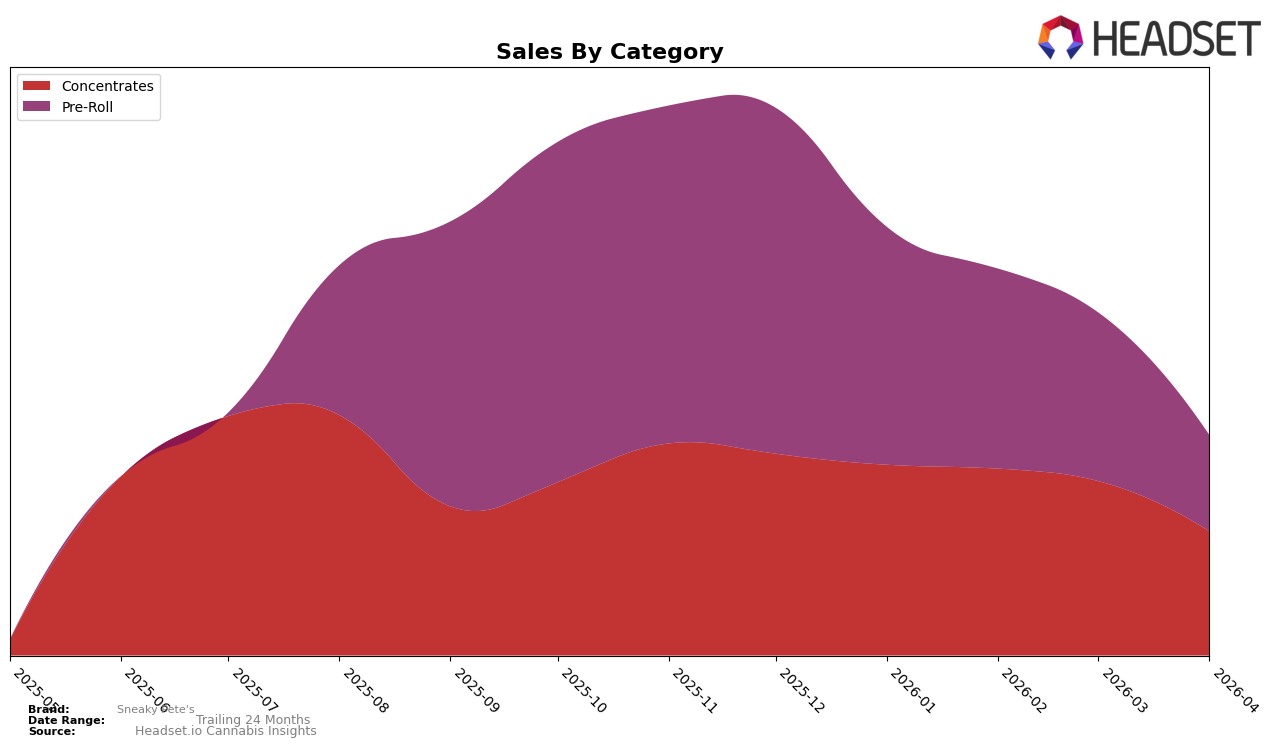
Sneaky Pete's has experienced notable shifts in its market performance across different categories and regions. In the state of New Jersey, the brand's presence in the Concentrates category has seen some fluctuation. Starting the year at the 20th rank in January, Sneaky Pete's managed a slight improvement to 19th in February. However, the subsequent months saw a decline, with the brand dropping to 21st in March and further down to 27th by April. This decline in ranking is mirrored by a decrease in sales, with April's figures significantly lower than those in January. Such movements may indicate a competitive market environment or shifts in consumer preferences within the Concentrates category.
In contrast, Sneaky Pete's performance in the Pre-Roll category in New Jersey paints a more challenging picture. The brand did not make it into the top 30 at any point in the first four months of 2026, starting at 50th in January and slipping further to 74th by April. This consistent drop suggests that Sneaky Pete's may be struggling to maintain a foothold in this category, possibly due to stronger competition or a need for strategic adjustments. While the Pre-Roll category shows more severe ranking challenges, the overall decline in sales across both categories hints at broader issues that the brand may need to address to regain its competitive edge in the market.
Competitive Landscape
In the competitive landscape of the New Jersey concentrates market, Sneaky Pete's experienced notable fluctuations in rank and sales from January to April 2026. Initially holding a strong position at rank 20 in January, Sneaky Pete's improved slightly to rank 19 in February, before slipping to rank 21 in March and further down to rank 27 in April. This decline in rank correlates with a downward trend in sales, from $48,039 in January to $31,229 in April. In contrast, Full Tilt Labs showed a more volatile pattern, starting at rank 21 in January, dropping to 25 in February, then climbing to 19 in March before falling again to 29 in April. Meanwhile, Culture Craft Cannabis Collective demonstrated a positive trajectory, improving from rank 31 in January to 25 in April, with a corresponding increase in sales. The competitive dynamics suggest that while Sneaky Pete's initially held a competitive edge, its recent decline in both rank and sales highlights the need for strategic adjustments to regain market share against rising competitors like Culture Craft Cannabis Collective.

Notable Products
In April 2026, Cocoa Bomb Infused Pre-Roll (1g) maintained its position as the top-selling product for Sneaky Pete's, with sales reaching 1130 units. Blank Check Infused Pre-Roll (1g) improved its ranking from third to second place compared to March, despite a decrease in sales to 228 units. Under the Z Infused Pre-Roll (1g) slipped from second to third place, continuing its downward trend from February. Razzle Dazzle - 24K Kief (2g) entered the rankings for the first time, securing fourth place in the concentrates category. Kaizen Kief (2g) followed closely, debuting at fifth place in the same category.
Top Selling Cannabis Brands
Data for this report comes from real-time sales reporting by participating cannabis retailers via their point-of-sale systems, which are linked up with Headset’s business intelligence software. Headset’s data is very reliable, as it comes digitally direct from our partner retailers. However, the potential does exist for misreporting in the instance of duplicates, incorrectly classified products, inaccurate entry of products into point-of-sale systems, or even simple human error at the point of purchase. Thus, there is a slight margin of error to consider. Brands listed on this page are ranked in the top twenty within the market and product category by total retail sales volume.

