.svg)

Sep-2026
Sales
Trend
6-Month
Product Count
SKUs
Avg Price
YoY Sales Change
YoY Price Change


Market Insights Snapshot
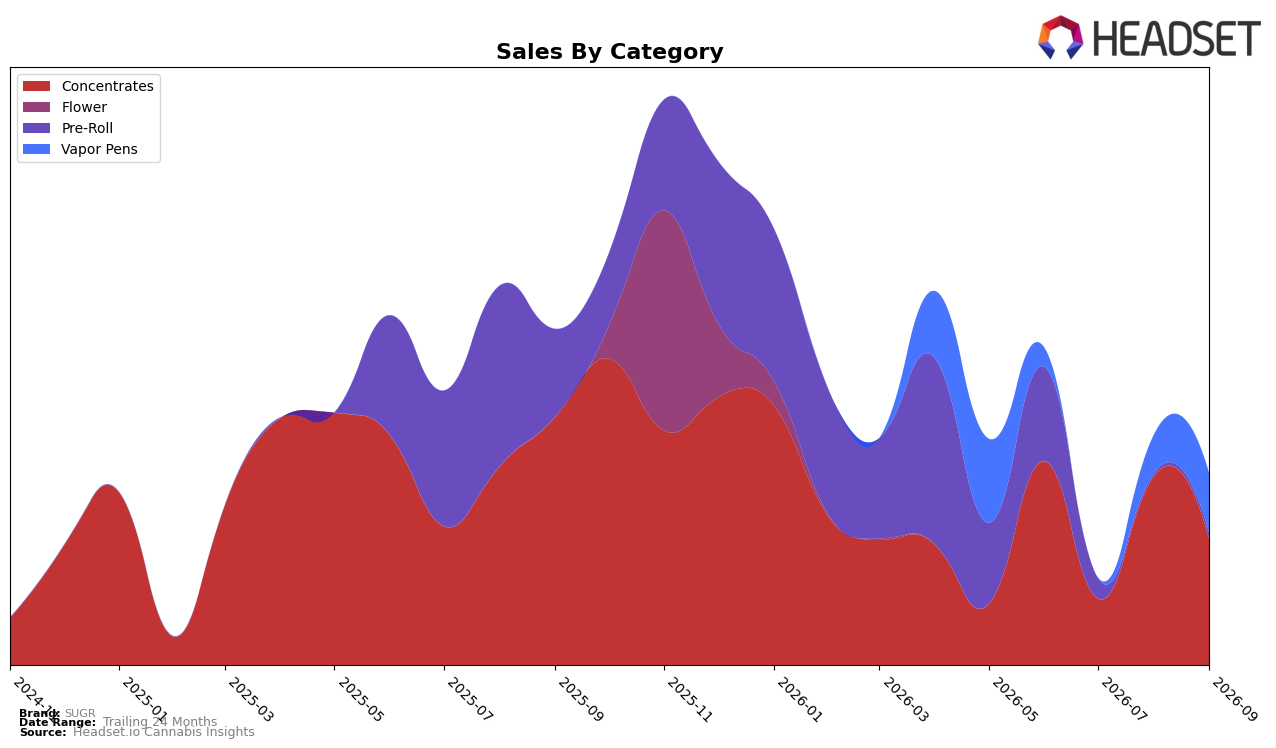
SUGR’s category mix in September 2026 tilted heavily toward Concentrates at 65.6% share, but that anchor contracted with a 49.6% year-over-year decline and a 33.7% month-over-month drop, while overall brand sales fell 43.2% YoY alongside a 2.9% YoY dip in average price. Vapor Pens expanded to 31.1% share on a 55.3% MoM increase (YoY unavailable), and Pre-Roll, despite only 3.3% share, surged 118.3% MoM against a 92.9% YoY fall. This mix points to a rebalancing away from a shrinking core toward faster-moving extensions, implying SUGR is trading off depth in its lead category for broader shelf coverage as short-term momentum consolidates outside its legacy base.
Positionally, a 10th-place rank in Concentrates in Alberta coupled with a 33.7% MoM decline in that category and a 55.3% MoM lift in Vapor Pens suggests SUGR is ceding rank headroom where it is most established while pursuing volume where price points are 32.5% lower than Concentrates. With Pre-Roll rebounding 118.3% MoM off a compressed base but still carrying a 92.9% YoY drop and just 3.3% share, the near-term positioning skews toward opportunistic gains in lighter-ticket formats rather than reinforcing premium Concentrates, implying margin and brand equity may hinge on stabilizing Concentrates while using Vapor Pens as an acquisition funnel.
Competitive Landscape
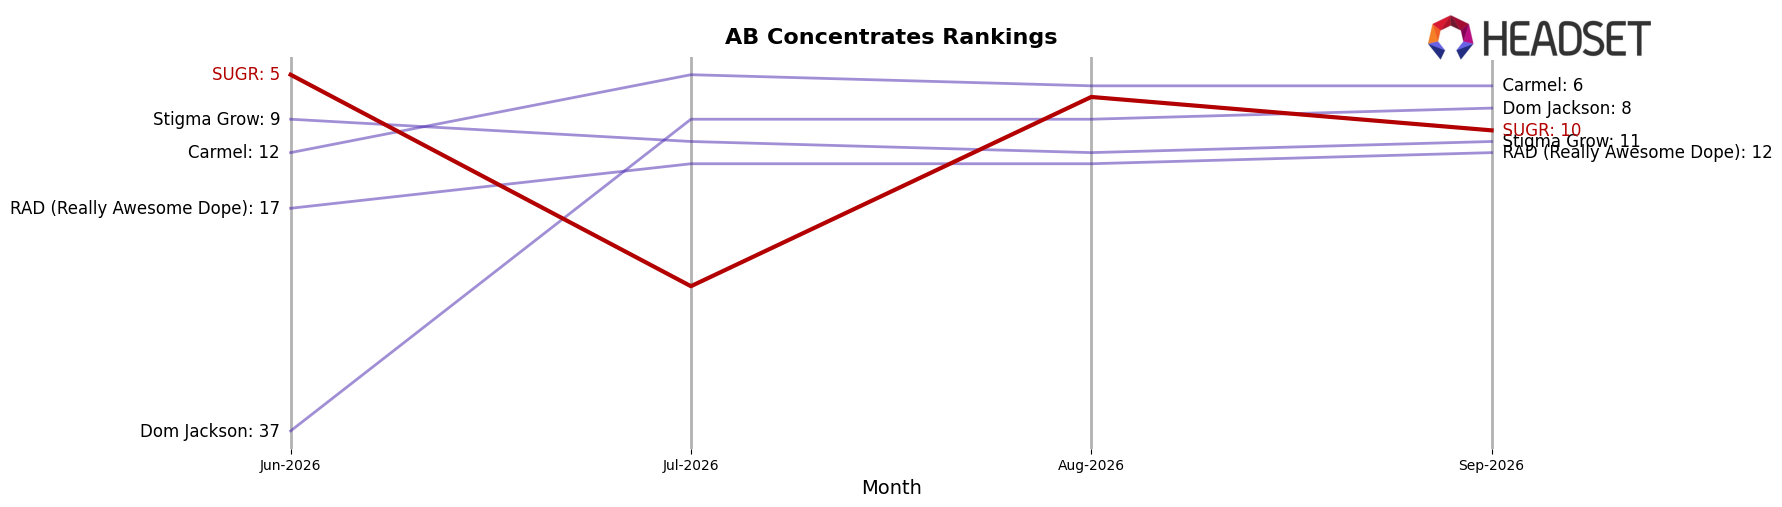
SUGR sits at rank #10 in AB Concentrates in September 2026, down 6 positions from #4 year over year, after sliding from #5 in June–August to #10 and away from its peak at #4 in January 2026; meanwhile, BoxHot holds #1 with sales up 5.83% year over year and Dab Bods sits at #3 with sales up 60.20%, while Endgame at #2 is down 3.15% YoY and Sticky Greens at #5 surged from #61 YoY with a 2,757.03% increase; the combination of a 6-rank YoY decline and a 5-to-10 drop since June indicates SUGR is losing relative velocity to fast-advancing rivals and must counter share capture concentrated among top-5 movers.
Notable Products
Drop Culture Sticks Pre-Roll 5-Pack (3.5g) posted the largest movement in September 2026 with +118.3% MoM to rank 4, while Cloudz Live Hash Rosin Disposable (0.5g) climbed +55.3% MoM to rank 1, implying momentum is shifting toward format convenience at both the top and mid ranks. In contrast, Gas Leak Live Rosin (1g) fell -30.0% MoM at rank 2 and Sweet Tooth Live Rosin (1g) dropped -35.6% MoM at rank 3, as three Concentrates SKUs still occupy ranks 2–5 even with mixed trajectories, suggesting category share is retained but under pressure from volatility. With four of the top five anchored by Concentrates and only one Vapor Pen leading on +55.3% MoM, the product mix points to a transition where inhalable convenience can capture rank leadership even as legacy rosin SKUs cycle down. The combined effect implies SUGR’s commercial direction is tilting toward portable formats that can scale quickly on promotions while maintaining a concentrated base that may need price-pack or strain refreshes to stabilize.
Top Selling Cannabis Brands






Data for this report comes from real-time sales reporting by participating cannabis retailers via their point-of-sale systems, which are linked up with Headset’s business intelligence software. Headset’s data is very reliable, as it comes digitally direct from our partner retailers. However, the potential does exist for misreporting in the instance of duplicates, incorrectly classified products, inaccurate entry of products into point-of-sale systems, or even simple human error at the point of purchase. Thus, there is a slight margin of error to consider. Brands listed on this page are ranked in the top twenty within the market and product category by total retail sales volume.

