Jun-2026
Sales
Trend
6-Month
Product Count
SKUs
Avg Price
YoY Sales Change
YoY Price Change
Market Insights Snapshot
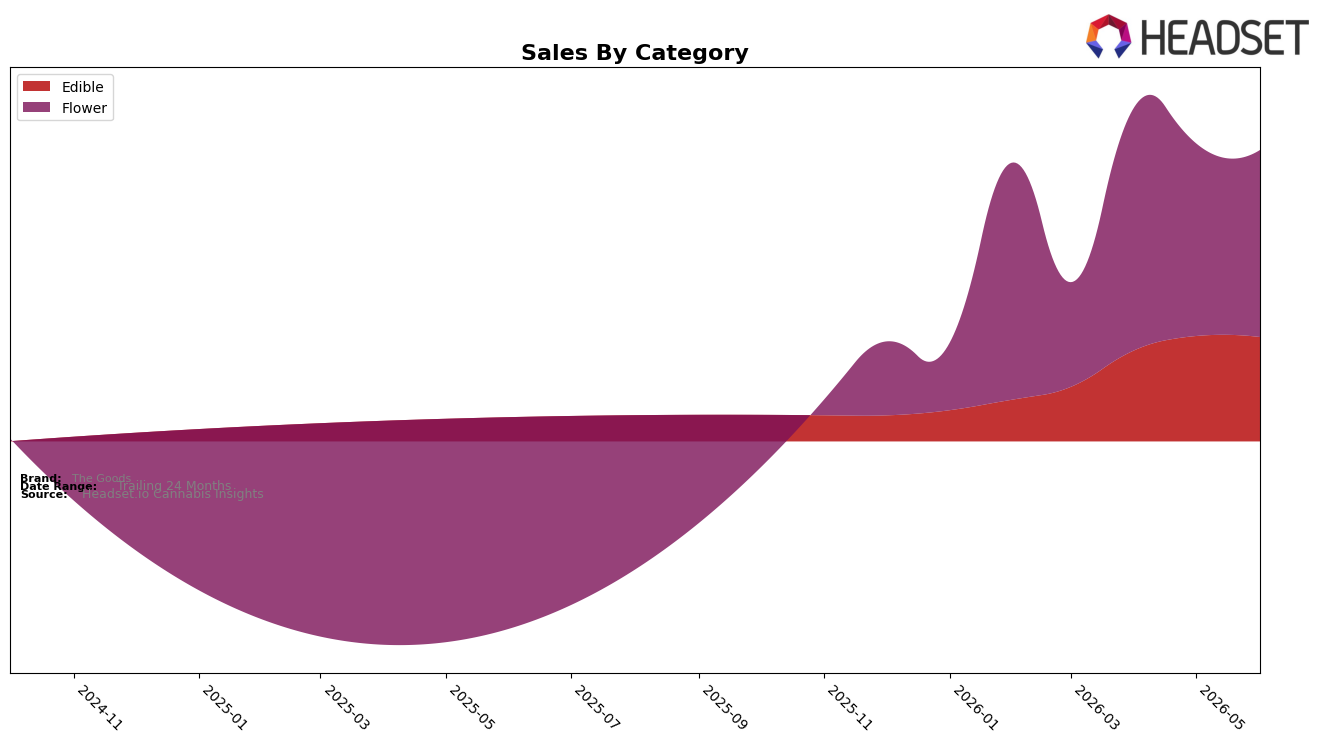
The Goods concentrated 64.20% of June 2026 sales in Flower and 35.80% in Edible, while Flower slipped 2.85% month over month and Edible eased 0.98% month over month, indicating pullback across both pillars. Within Flower, average price at $32.29 against a brand-wide $23.35 mix price implies a premium tilt, yet the -2.85% decline paired with a 49 rank in Ohio Flower suggests limited traction at the category’s current price-to-volume balance; the thesis is that overreliance on a higher-priced Flower mix is constraining momentum when both categories are contracting.
Because Edible holds 35.80% share but carries a lower average price at $15.60 alongside a gentler -0.98% month-over-month dip, the mix shift opportunity points toward margin-volume tradeoffs that could stabilize rank from 49 in Ohio by reallocating focus where price elasticity is more forgiving. With Flower down 2.85% versus a 0.98% decline in Edible, maintaining a 64.20% Flower weighting risks further slippage; the thesis is that modestly rebalancing toward Edible or adjusting Flower price architecture could improve sell-through without sacrificing the brand’s June 2026 positioning baseline.
Competitive Landscape
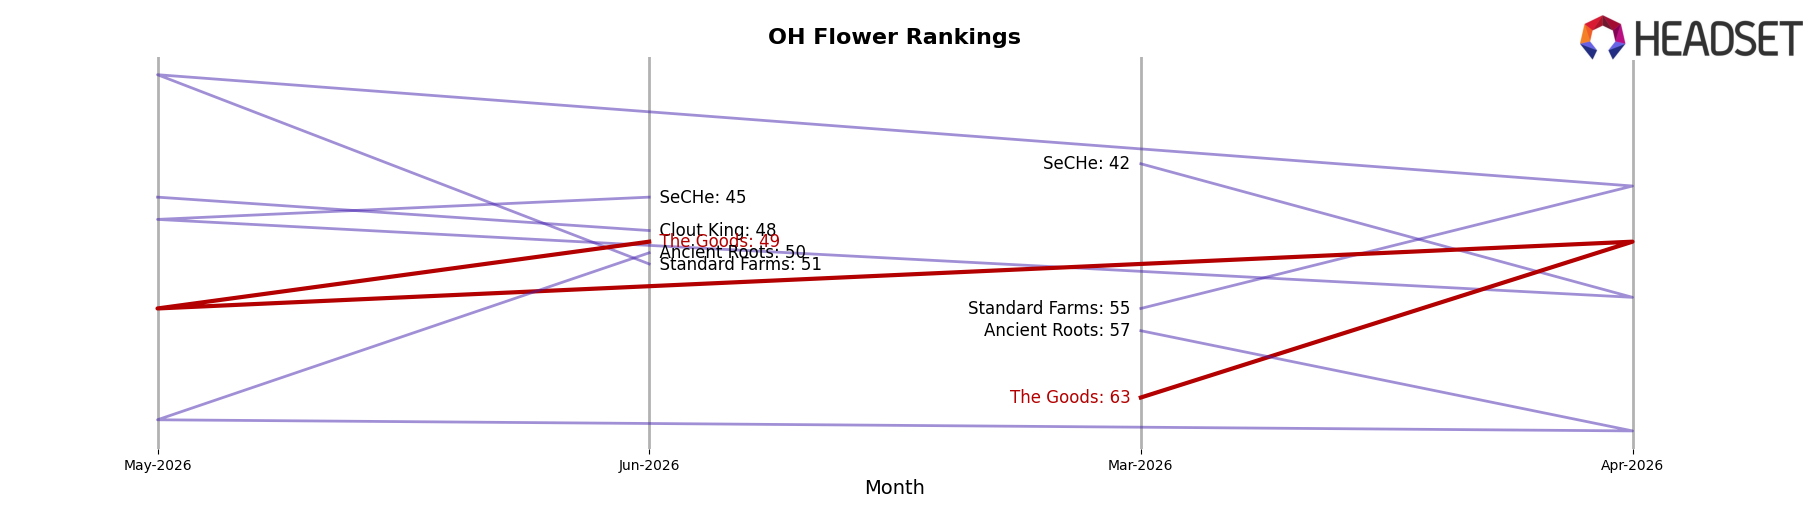
The Goods is ranked #49 in Ohio Flower in June 2026, improving 14 positions from #63 in March 2026, while its peak of #44 in February 2026 is 5 spots higher than today, indicating partial reversion after a short-term high; in directional contrast, Klutch Cannabis climbed to #1 with a 20-place YoY rise and 304.8% YoY sales growth, and Riviera Creek sits at #2 despite a 1-rank YoY gain paired with a 22.7% YoY sales decline, implying The Goods’ rank trajectory is stabilizing mid-pack, with recent gains tied more to quarter-over-quarter momentum than to the category’s top-end shifts.
Notable Products
Black Amber (2.83g) posted the standout movement in June 2026 with a 235% month-over-month surge to $39,935 and entered the leaderboard at rank 2, while Spritz (2.83g) plunged 69% month over month and still held rank 7, indicating volatility within Flower at both extremes. Strawberry Lemonade Gummies 10-Pack (100mg) fell 51% month over month yet remained rank 1, whereas Mango Passion Gummies 10-Pack (100mg) inched up 5% at rank 3, showing Edibles can retain top placement even with mixed momentum. Four of the top ten are Edible SKUs and six are Flower SKUs, with Edibles occupying ranks 1 through 5 and Flower filling ranks 2 and 6–10, which points to a barbell where Edibles anchor the top slots while Flower drives swingy upside and downside. The pattern implies The Goods is tilting commercial focus toward sustaining Edible leadership while selectively scaling breakout Flower strains that can spike share but require tighter inventory and promo controls.
Top Selling Cannabis Brands
Data for this report comes from real-time sales reporting by participating cannabis retailers via their point-of-sale systems, which are linked up with Headset’s business intelligence software. Headset’s data is very reliable, as it comes digitally direct from our partner retailers. However, the potential does exist for misreporting in the instance of duplicates, incorrectly classified products, inaccurate entry of products into point-of-sale systems, or even simple human error at the point of purchase. Thus, there is a slight margin of error to consider. Brands listed on this page are ranked in the top twenty within the market and product category by total retail sales volume.

