.svg)

Aug-2026
Sales
Trend
6-Month
Product Count
SKUs
Avg Price
YoY Sales Change
YoY Price Change


Where to Buy
Treats is stocked at 80 licensed dispensaries across Washington, with the deepest coverage in Tacoma, Olympia, Seattle, Spokane, and Everett. Search by ZIP code or city below to find the closest one, or filter by product type if you are after a specific format.
Market Insights Snapshot
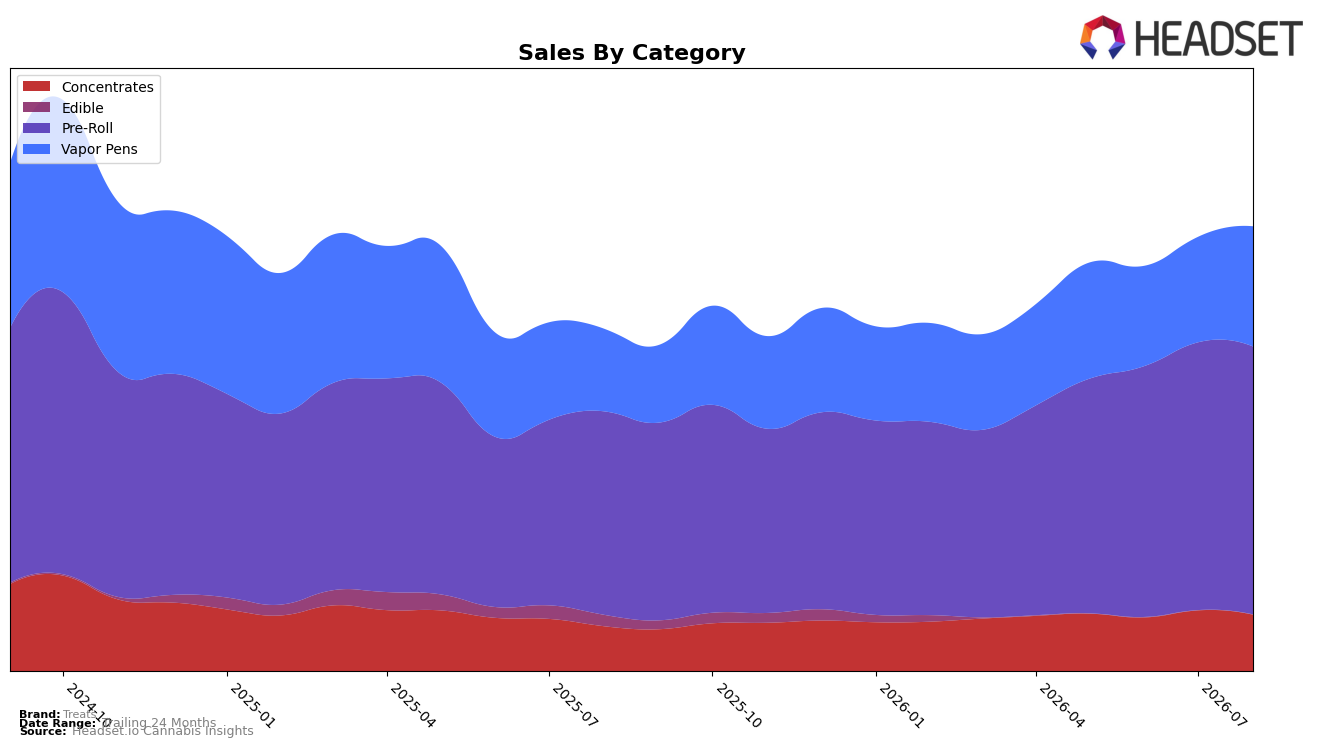
In August 2026, Treats concentrated 60.31% of sales in Pre-Roll with year-over-year growth of 31.71% and month-over-month essentially flat at 0.06%, while Vapor Pens expanded to 27.04% share with year-over-year growth of 45.55% and month-over-month up 14.01%. Concentrates held 12.63% share with year-over-year growth of 25.81% but declined month-over-month by 7.16%, and Edible contracted to 0.02% share with year-over-year down 99.14% despite a 5.18% month-over-month uptick. Average price fell 7.89% year-over-year to $3.65 as Pre-Roll’s average price sat at 2.72 and Vapor Pens at 9.22, indicating mix and pricing both pulled effective price lower; the pattern implies Treats is leaning into lower-priced Pre-Roll volume while accelerating Vapor Pens to diversify growth without resetting the Pre-Roll anchor.
Treats held rank 29 in Pre-Roll in Washington while Vapor Pens gained share faster month-over-month by 13.95 percentage points relative to Pre-Roll’s 0.06%, and Concentrates’ 7.16% month-over-month decline contrasts with a 25.81% year-over-year lift. With brand sales up 29.99% year-over-year but down 21.88% versus 24 months, and Pre-Roll contributing 60.31% at a 31.71% year-over-year rate, the signal is that short-term growth is being rebuilt on a price-accessible Pre-Roll base while the 27.04% Vapor Pens mix pivot improves margin potential; this implies Treats is repositioning toward a two-pillar portfolio that sustains volume through Pre-Roll while using faster-growing Vapor Pens to close the longer-term gap.
Competitive Landscape
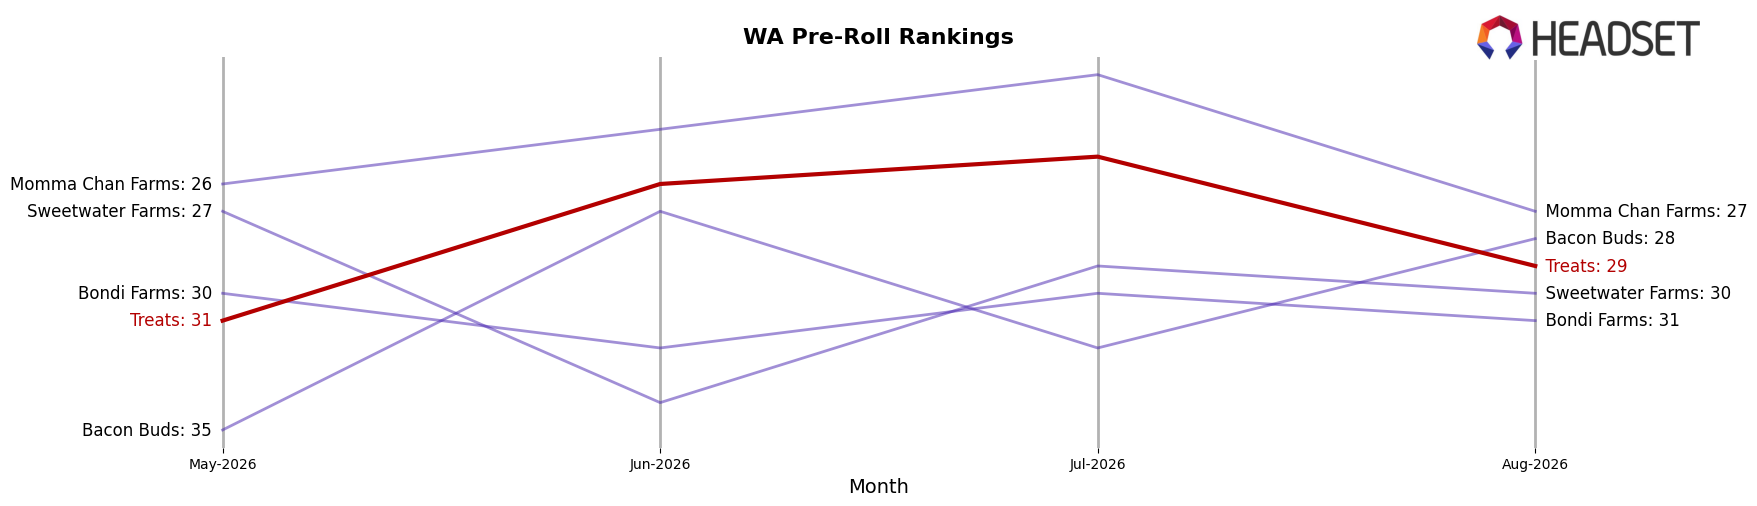
Treats is currently ranked #29 in WA Pre-Roll for August 2026, improving 7 positions year over year from #36, while slipping 2 positions versus three months ago from #31; against its historical context, it remains 5 spots below its peak of #24 set in September 2024, indicating recovery but not a return to prior ceiling. Competitive pressure is acute at the top where Ooowee held #1 year over year with 53.1% sales growth and Phat Panda stayed at #2 with 7.9% growth, while Lifted Cannabis Co climbed from #6 to #4; this stability and upward mobility among leaders contrasts with Treats’ modest YoY rank gain of 7 positions and a 2-position quarter-on-quarter slide, implying that Treats’ trajectory points to incremental share clawback that risks stalling unless conversion accelerates against entrenched and rising incumbents.
Notable Products
Pog Infused Pre-Roll (1g) posted the standout movement in August 2026 with a +46% month-over-month surge to rank 3, while category leader Blueberry Pie Infused Pre-Roll (1g) slipped -2% but held rank 1. Birthday Cake Infused Pre-Roll (1g) advanced +15% at rank 2, and Cotton Candy Infused Pre-Roll (1g) rose +26% at rank 6, indicating gains are concentrated in mid-pack SKUs rather than the top spot. With nine of the top ten positions occupied by Pre-Roll SKUs and only modest declines like -4% for Strawberry Shortcake Infused Pre-Roll (1g) at rank 4, the mix tilts toward flavor-variant breadth over rotation of a single hero. This pattern implies Treats is consolidating a flavor-led Pre-Roll portfolio where mid-tier climbers fuel incremental growth more than shifts at rank 1.
Top Selling Cannabis Brands






Data for this report comes from real-time sales reporting by participating cannabis retailers via their point-of-sale systems, which are linked up with Headset’s business intelligence software. Headset’s data is very reliable, as it comes digitally direct from our partner retailers. However, the potential does exist for misreporting in the instance of duplicates, incorrectly classified products, inaccurate entry of products into point-of-sale systems, or even simple human error at the point of purchase. Thus, there is a slight margin of error to consider. Brands listed on this page are ranked in the top twenty within the market and product category by total retail sales volume.

