Jun-2026
Sales
Trend
6-Month
Product Count
SKUs
Avg Price
YoY Sales Change
YoY Price Change
Market Insights Snapshot
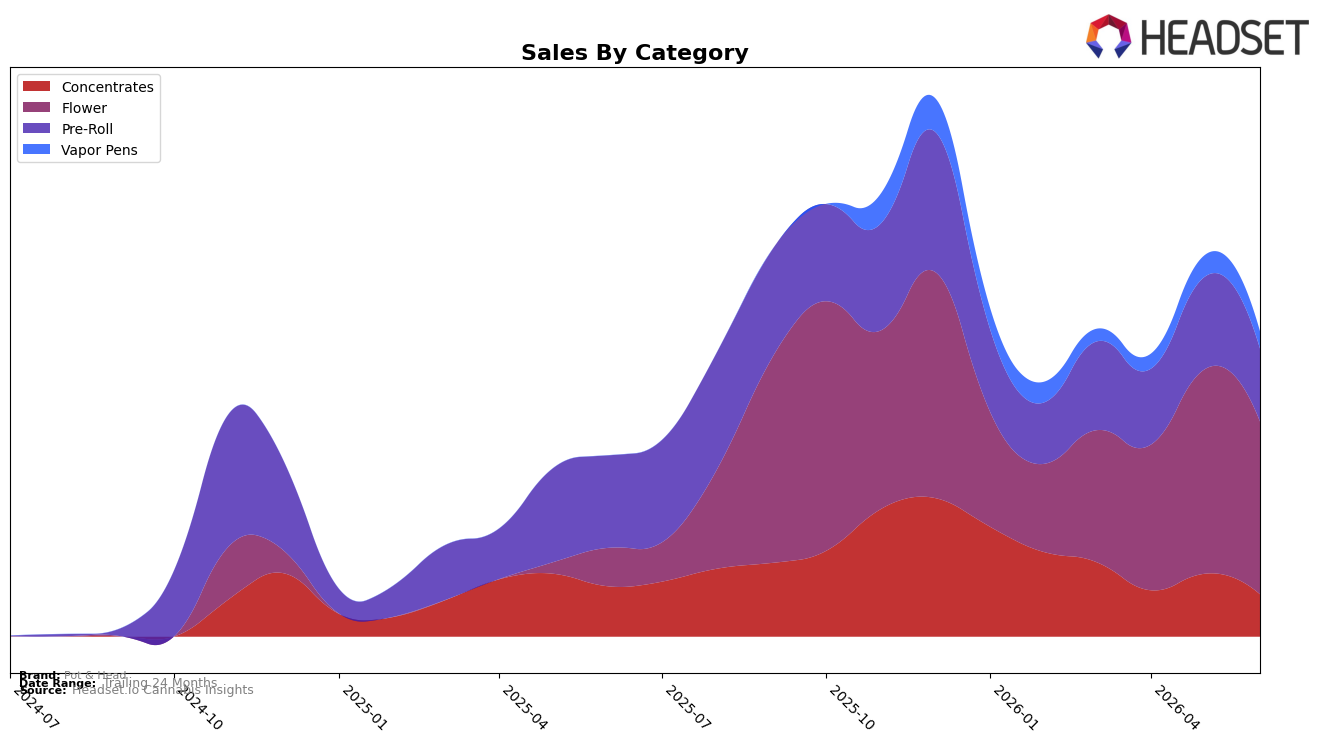
Pot & Head’s category mix in June 2026 consolidated around Flower at 56.66% share, with Flower sales up 351.63% year over year while down 15.52% month over month; in contrast, Pre-Roll held 23.88% share with a 21.20% YoY decline and a 21.14% MoM drop. Concentrates represented 13.86% share with a 15.89% YoY decline and a sharper 32.73% MoM pullback, and Vapor Pens at 5.60% share declined 20.66% MoM with no YoY baseline; alongside a 25.72% YoY increase in average price and brand-level sales growth of 68.55% YoY, the mix indicates a pivot toward higher-ticket Flower even as near-term volume softness hits multiple formats, implying intentional reweighting rather than broad demand loss.
With Flower ranked 74 in New York and carrying a 56.66% mix share alongside a 15.52% MoM decline, the brand’s push into Flower raises exposure to rank volatility, while the simultaneous 21.14% MoM drop in Pre-Roll and 32.73% MoM drop in Concentrates suggest shelf rationalization away from faster-turn, lower-priced formats; paired with a 25.72% YoY price lift and a 351.63% YoY surge in Flower, the positioning skews toward premiumized Flower that can lift revenue per unit but risks short-term basket frequency, implying the brand is trading depth in one category for breadth across the portfolio.
Competitive Landscape
Pot & Head sits at rank #74 in NY Flower for June 2026, up 75 positions year over year from #149 and 10 spots from March 2026’s #84, yet still 22 places below its peak of #52 reached in October 2025; meanwhile, Find. advanced from #3 to #1 with a 35.6% YoY sales increase and RYTHM moved from #10 to #5 with 40.6% YoY growth, indicating competitors are consolidating higher ranks faster than Pot & Head’s mid-table climb. The combination of a 75-position YoY improvement and only a 10-position gain over the last three months, alongside rivals moving into the top 5, implies Pot & Head’s trajectory is upward but insufficient to regain or surpass its October 2025 peak without accelerating growth relative to leaders.

Notable Products
Mythic Cheetah Pre-Roll (1g) posted the steepest decline at -85.9% month over month and slid to rank 9, while Skunk OG Pre-Roll (1g) fell -26.0% to rank 4; by contrast, Blue Dream Pre-Roll (1g) surged +65.5% to rank 1. With pre-rolls occupying seven of the top ten and two flower SKUs holding ranks 8 and 10, the mix signals volatility concentrated in pre-rolls alongside steadier placement for large-format flower. This pattern implies Pot & Head is leaning into pre-roll breadth but absorbing sharper downside risk within that category.
Blue Dream Pre-Roll (1g) led June 2026 with a +65.5% MoM jump at rank 1, while Ice Cream Cake Pre-Roll (1g) contracted -12.5% at rank 2 and Velvet Kush Hash Infused Pre-Roll (1g) declined -22.8% at rank 7. Mega Squirt Hash Cube (1g) in concentrates grew +7.3% at rank 6 against a pre-roll-heavy leaderboard, and Garlic Breath (28g) entered at rank 8 with $25,422 in sales. The dispersion of gains and losses across adjacent rank positions implies demand is trading between strains rather than expanding category-wide, nudging assortment decisions toward hero SKUs with defensible rank stability.
Top Selling Cannabis Brands
Data for this report comes from real-time sales reporting by participating cannabis retailers via their point-of-sale systems, which are linked up with Headset’s business intelligence software. Headset’s data is very reliable, as it comes digitally direct from our partner retailers. However, the potential does exist for misreporting in the instance of duplicates, incorrectly classified products, inaccurate entry of products into point-of-sale systems, or even simple human error at the point of purchase. Thus, there is a slight margin of error to consider. Brands listed on this page are ranked in the top twenty within the market and product category by total retail sales volume.

