.svg)


Where to Buy
Vera is stocked at 83 licensed dispensaries across Colorado and Michigan, 64 of them in Colorado, with the deepest coverage in Denver, Aurora, Boulder, Grand Junction, and Longmont. Search by ZIP code or city below to find the closest one, or filter by product type if you are after a specific format.
Market Insights Snapshot
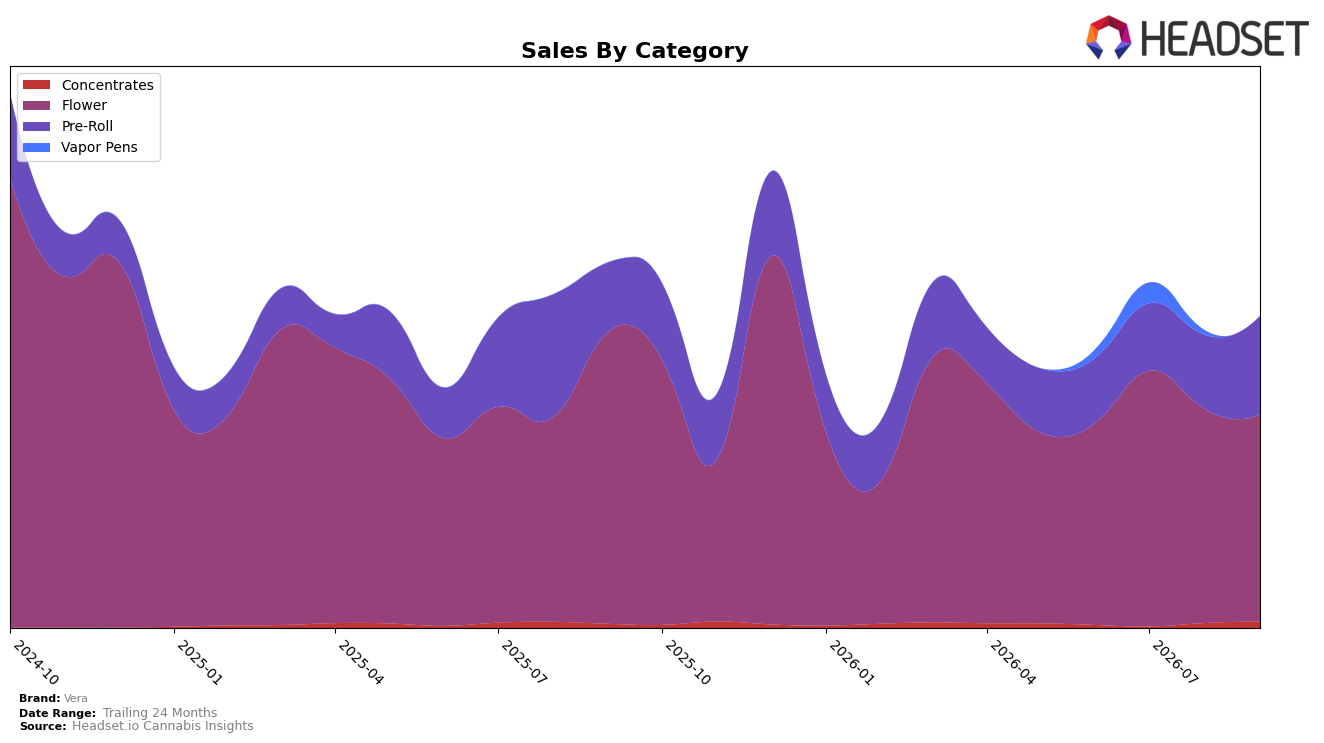
Vera concentrated 66.50% of September 2026 sales in Flower while Pre-Roll reached 31.58% and Concentrates 1.92%, shifting mix away from last year’s heavier Flower base. Flower declined 29.04% year over year and 3.29% month over month, while Pre-Roll grew 41.78% YoY and 33.07% MoM; Concentrates added 58.22% YoY and 31.98% MoM. With a brand-level average price down 21.44% YoY and Flower still the top category, the mix pivot implies Vera is trading volume into lower-ticket units even as premium subsegments in Concentrates grow from a small base.
Vera’s rank of 31 in Flower within Colorado, combined with a 29.04% Flower YoY decline and a 33.07% MoM lift in Pre-Roll, suggests near-term share defense depends on accelerating multi-pack or value-led formats rather than relying on core eighths. The 58.22% YoY rise in Concentrates alongside a 21.44% YoY brand price decline points to a barbell positioning—volume anchored in lower-price Pre-Rolls and margin potential in a small but faster-growing Concentrates niche—implying pricing discipline in Flower and pack architecture in Pre-Roll are the levers to stabilize overall sales after a 14.67% brand YoY contraction.
Competitive Landscape
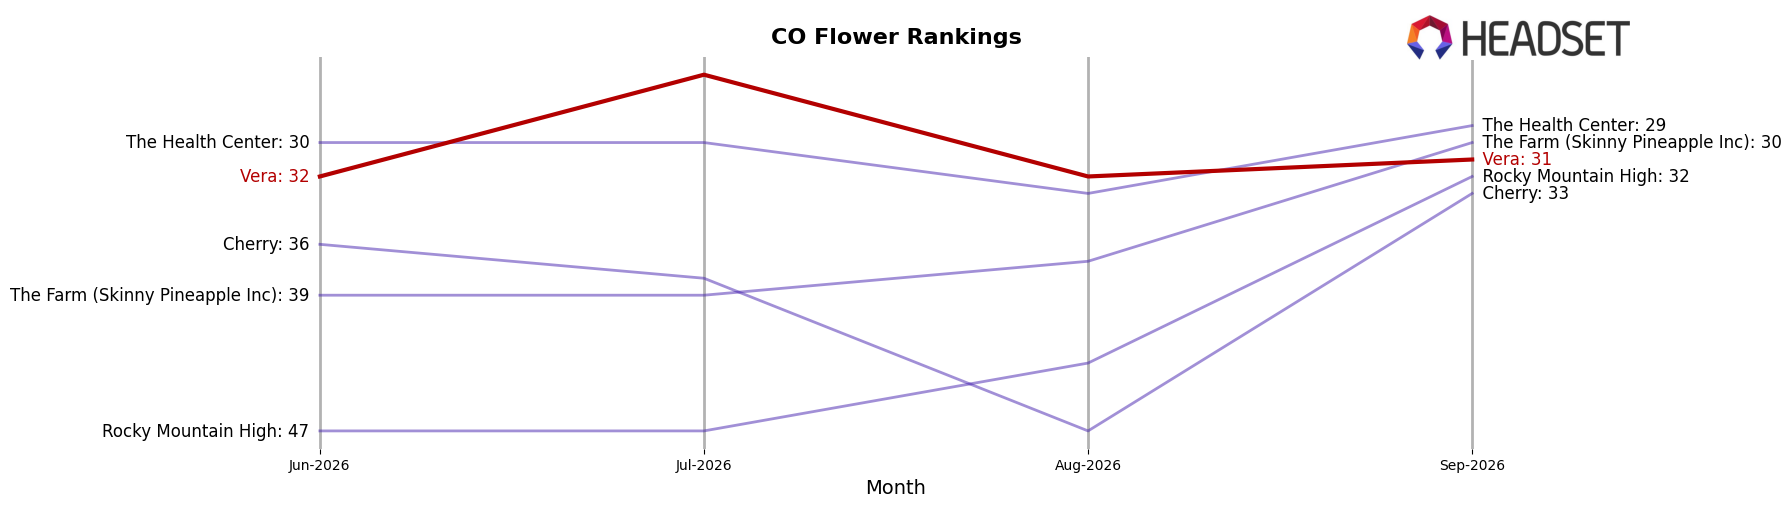
Vera sits at rank #31 in Colorado Flower in September 2026, improving 15 positions from #46 year over year, while slipping 1 place from #32 over the last three months; the brand’s historical ceiling remains #14 from October 2024, indicating a gap of 17 ranks to its peak. In contrast, Green Label Cannabis held at #1 year over year with 38.0% sales growth, and Good Chemistry Nurseries advanced from #3 to #2 with 45.5% growth, whereas Seed & Strain Cannabis Co. fell from #2 to #4 alongside a 33.5% sales decline; against this reshuffling, Vera’s +15-rank YoY climb paired with a minor 1-rank quarter slip implies momentum that is improving on an annual basis but not yet translating into sustained weekly share capture relative to the top five.
Notable Products
Cheech & Chong - Drooler Pre-Roll (1g) posted the steepest movement in September 2026 with a -11.6% month-over-month decline while sitting at rank 10, contrasting with Magentaz Pre-Roll (1g) up 2.3% at rank 6 and Donny Burger (7g) up 11.9% at rank 7. Four of the top ten are Pre-Roll SKUs concentrated in ranks 1, 3, 6, and 10, yet Red Dawn (Bulk) at rank 8 fell 29.8% month over month, indicating category momentum is uneven beneath the headline share. The pattern implies Vera is leaning into Pre-Rolls for visibility while bulk Flower volatility creates execution risk in weight-based offerings.
Top Selling Cannabis Brands






Data for this report comes from real-time sales reporting by participating cannabis retailers via their point-of-sale systems, which are linked up with Headset’s business intelligence software. Headset’s data is very reliable, as it comes digitally direct from our partner retailers. However, the potential does exist for misreporting in the instance of duplicates, incorrectly classified products, inaccurate entry of products into point-of-sale systems, or even simple human error at the point of purchase. Thus, there is a slight margin of error to consider. Brands listed on this page are ranked in the top twenty within the market and product category by total retail sales volume.

