Sep-2025
Sales
Trend
6-Month
Product Count
SKUs
Avg Price
YoY Sales Change
YoY Price Change
Market Insights Snapshot
Yeti Farms has shown notable progress in the cannabis market, particularly in the Michigan pre-roll category. Starting at rank 99 in June 2025, the brand climbed to rank 73 by September 2025, indicating a positive trajectory. This upward movement was accompanied by a consistent increase in sales, suggesting growing consumer interest and market penetration. However, in Oregon, Yeti Farms experienced a more fluctuating performance in the pre-roll category, where it ranked 61 in June, dropped out of the top 30 in July, and re-entered the rankings at 99 in August before improving slightly to 85 in September. The inconsistency in Oregon highlights potential challenges in maintaining a steady market position.
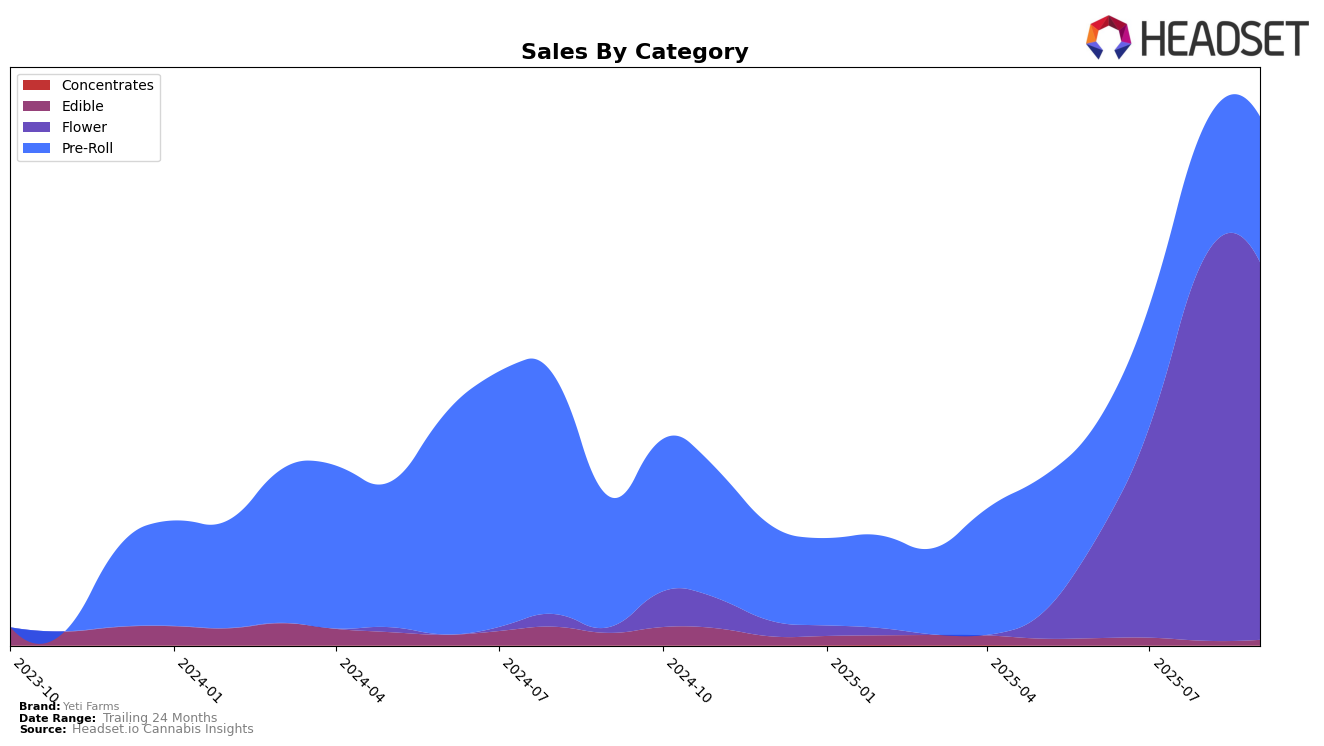
In New Jersey, Yeti Farms demonstrated strong growth in the flower category, moving from rank 58 in June to 28 by September. This consistent improvement suggests a strengthening brand presence and consumer preference in this category. Notably, the brand's pre-roll category in New Jersey did not maintain a top 30 ranking after June, which could indicate a strategic shift or a focus on other product categories. Overall, Yeti Farms' performance across different states and categories reveals a dynamic and evolving brand strategy, with significant gains in some areas and challenges in others.
Competitive Landscape
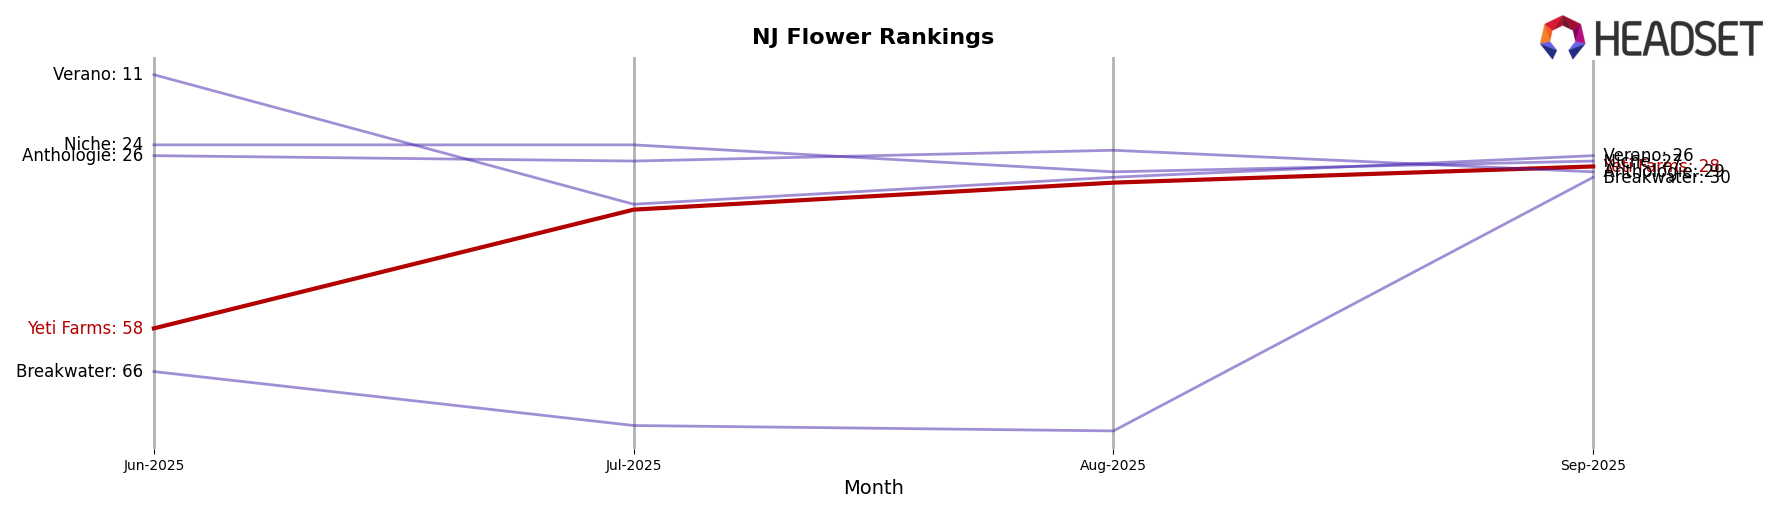
In the competitive landscape of the New Jersey flower category, Yeti Farms has demonstrated a remarkable upward trajectory in its ranking over the past few months. Starting from a rank of 58 in June 2025, Yeti Farms climbed to 28 by September 2025, showcasing a consistent improvement in its market position. This upward trend is particularly notable when compared to competitors like Verano, which, despite having higher sales figures, experienced fluctuating ranks, ending at 26 in September. Anthologie and Niche maintained relatively stable positions, with Anthologie dropping slightly to 29 and Niche improving to 27. Meanwhile, Breakwater made a significant leap from being outside the top 20 to securing the 30th spot in September. This dynamic shift in rankings highlights Yeti Farms' growing influence and competitive edge in the New Jersey flower market, potentially driven by strategic marketing efforts and product differentiation.
Notable Products
In September 2025, the top-performing product for Yeti Farms was Blue Runtz Shake (28g) in the Flower category, achieving the first rank with sales of 2327 units. Gas Planet Pre-Roll 10-Pack (10g) improved its performance, rising to the second position from fourth in August. Blue Runtz Pre-Roll 10-Pack (10g) maintained a strong presence, holding steady at third place, despite a drop from the first position in June and July. GP II Pre-Roll 10-Pack (10g) entered the rankings at fourth place in September, marking its first appearance. Apple Cheesecake (3.5g), another Flower category product, debuted in the rankings at fifth place, indicating a diversification in top-sellers for Yeti Farms this month.
Top Selling Cannabis Brands
Data for this report comes from real-time sales reporting by participating cannabis retailers via their point-of-sale systems, which are linked up with Headset’s business intelligence software. Headset’s data is very reliable, as it comes digitally direct from our partner retailers. However, the potential does exist for misreporting in the instance of duplicates, incorrectly classified products, inaccurate entry of products into point-of-sale systems, or even simple human error at the point of purchase. Thus, there is a slight margin of error to consider. Brands listed on this page are ranked in the top twenty within the market and product category by total retail sales volume.

