.svg)
Sep-2026
Sales
Trend
6-Month
Product Count
SKUs
Avg Price
YoY Sales Change
YoY Price Change


Where to Buy
Your Highness is stocked at 119 licensed dispensaries across Massachusetts, Nevada, and California, 80 of them in Massachusetts, with the deepest coverage in Boston, Worcester, Northampton, Cambridge, and Brockton. Search by ZIP code or city below to find the closest one, or filter by product type if you are after a specific format.
Market Insights Snapshot
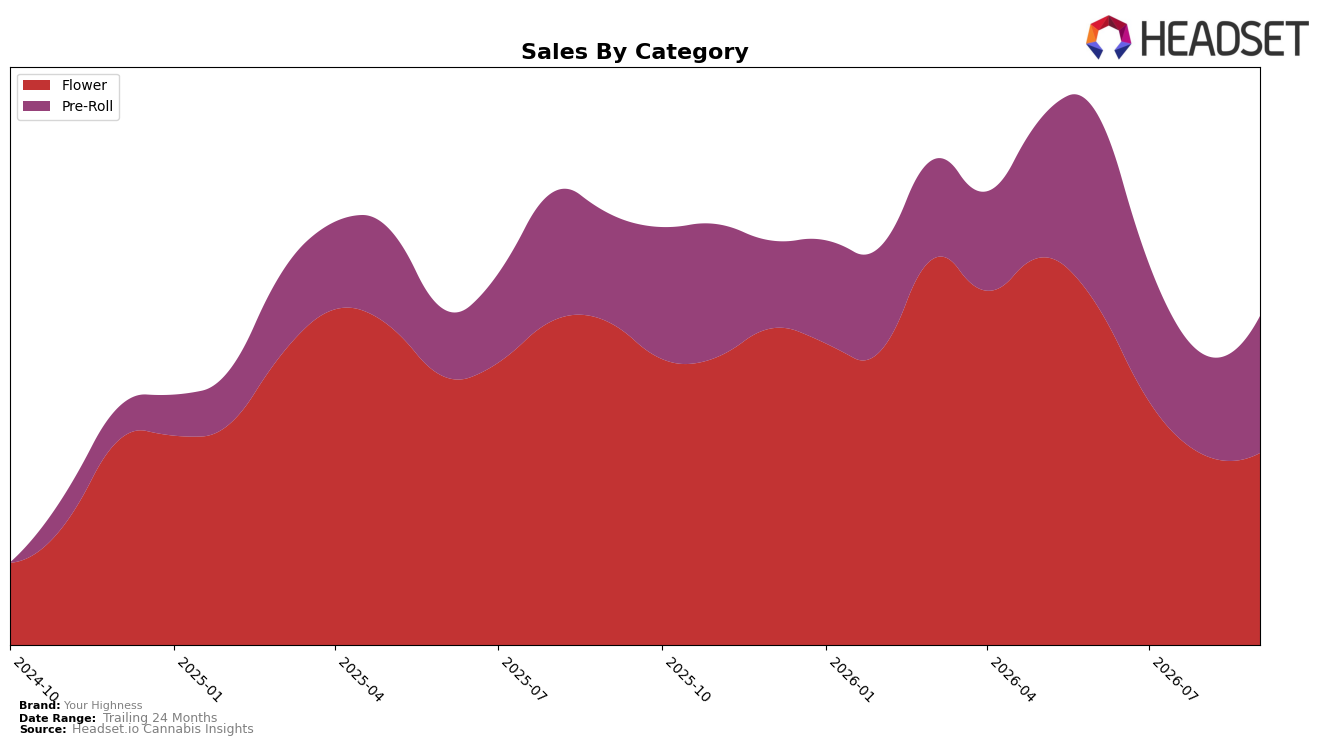
In September 2026, Your Highness concentrated sales in Flower at 57.79% share (rank 52 in Flower in Massachusetts) and Pre-Roll at 42.21% share, with category YoY splits pulling in opposite directions: Flower declined 39.10% YoY while Pre-Roll grew 23.28% YoY. Month over month, the mix tilted toward Pre-Roll as it rose 32.52% MoM while Flower edged up 1.14% MoM, alongside a 14.83% YoY drop in average price to one dollar figure of $16.60, indicating price pressure even as Pre-Roll gained weight. The pattern implies a pivot from legacy Flower dependence toward faster-turning Pre-Rolls that can offset a 22.56% brand-level YoY decline, but the rank at 52 suggests category-specific execution in Massachusetts Flower remains a constraint.
The simultaneous 23.28% YoY and 32.52% MoM gains in Pre-Roll, against a 39.10% YoY drop in Flower and a 1.14% MoM Flower uptick, implies Your Highness is repositioning toward value-accessible, impulse formats where price elasticity is favorable at a 14.83% YoY lower average price. With 57.79% of sales still in Flower and a state-category rank of 52, sustaining share will require translating Pre-Roll momentum (42.21% mix) into improved Flower velocity or further mix shift, because the current configuration signals margin trade-offs in exchange for volume recovery and a pathway to monetize the 196.76% 24-month brand expansion despite the September 2026 YoY contraction.
Competitive Landscape
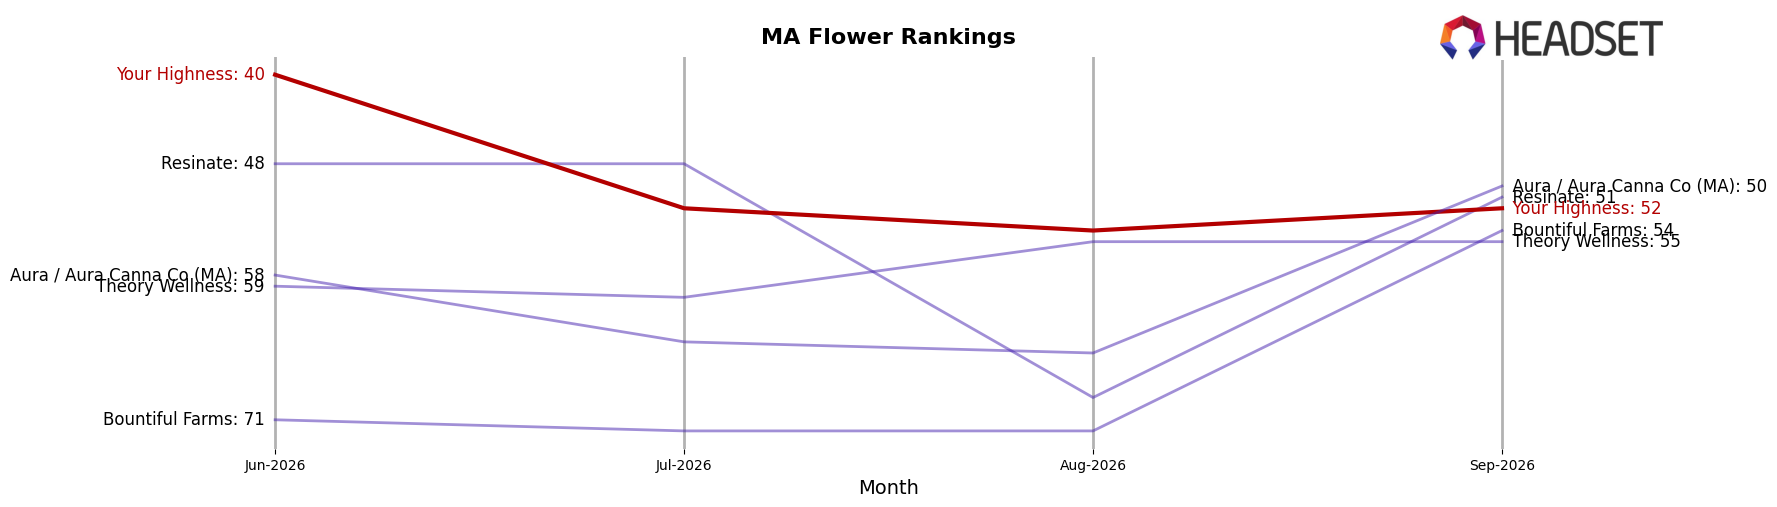
Your Highness is ranked #52 in MA Flower for September 2026, down 7 positions year over year from #45 and 12 positions below its June 2026 three-month reference point at #40; the brand also sits 24 spots below its March 2026 peak at #28, indicating a multi-quarter slide. In contrast, Perpetual Harvest climbed from #4 to #1 with 124.12% year-over-year sales growth, while Simply Herb slipped from #1 to #3 alongside a 16.59% sales decline, showing that leadership is rotating as momentum concentrates at the very top; this rank trajectory implies Your Highness is losing share of voice in a tightening top tier and must arrest rank erosion to avoid further drift from the peak cohort.
Notable Products
Rainbow Runtz Pre-Roll (1g) delivered the standout move in September 2026 with a 93.9% month-over-month gain and a climb to rank 2, while Uncle Snoop Pre-Roll (1g) dropped 33.0% and slid to rank 5. Bluephoria Pre-Roll (1g) held rank 1 with a 43.5% lift, and Lemon Jam Pre-Roll (1g) rose 47.3% to rank 3, meaning four of the top ten are Pre-Roll SKUs concentrated at ranks 1–3 and 5. In Flower, Bluephoria (3.5g) advanced 30.1% at rank 4 even as Lemon Jam (3.5g) fell 11.1% at rank 10, with Berry Blizzard (3.5g) entering at rank 9 and contributing $20,368. The pattern indicates a pivot toward Pre-Roll velocity at the very top of the chart, with selective Flower depth sustaining overall basket mix but ceding rank momentum to Pre-Rolls.
Top Selling Cannabis Brands






Data for this report comes from real-time sales reporting by participating cannabis retailers via their point-of-sale systems, which are linked up with Headset’s business intelligence software. Headset’s data is very reliable, as it comes digitally direct from our partner retailers. However, the potential does exist for misreporting in the instance of duplicates, incorrectly classified products, inaccurate entry of products into point-of-sale systems, or even simple human error at the point of purchase. Thus, there is a slight margin of error to consider. Brands listed on this page are ranked in the top twenty within the market and product category by total retail sales volume.

