Apr-2026
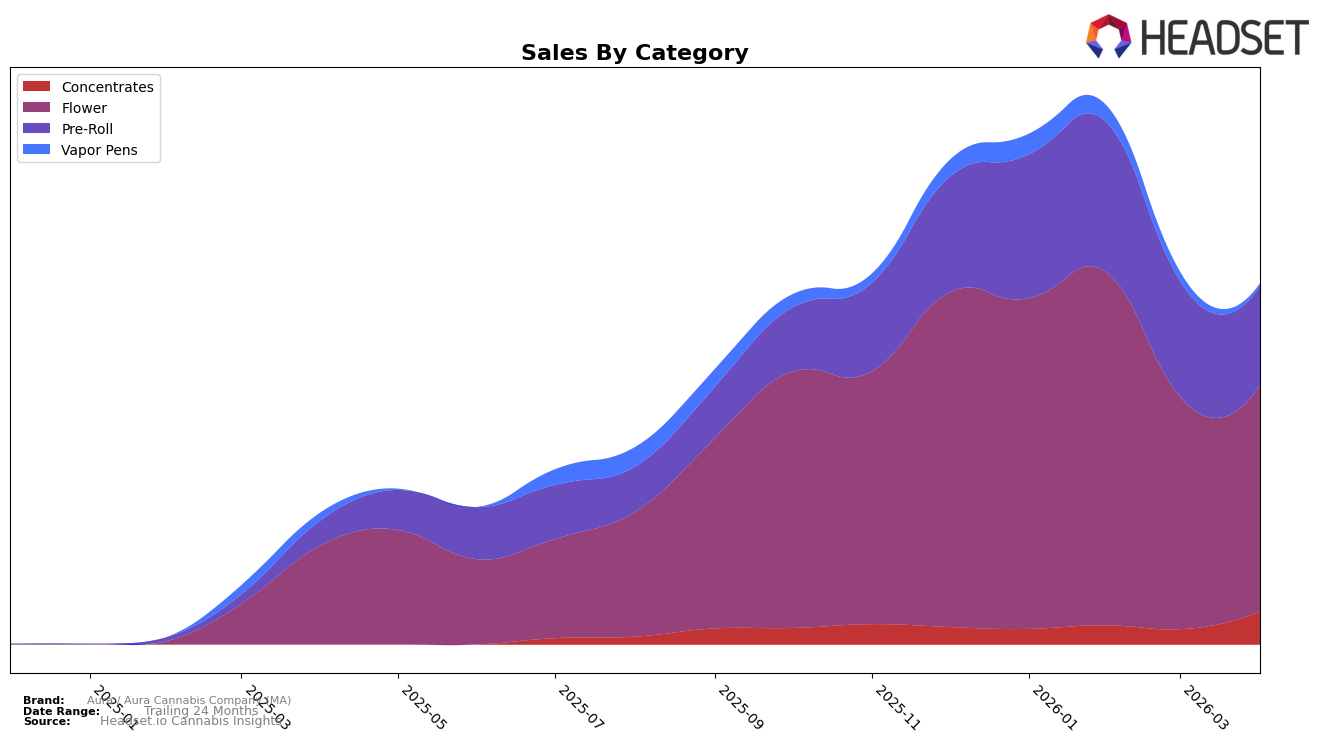
Sales
Trend
6-Month
Product Count
SKUs
Avg Price
YoY Sales Change
YoY Price Change
Market Insights Snapshot
The performance of Aura / Aura Cannabis Company (MA) in the Massachusetts market has shown notable fluctuations across various product categories. In the Concentrates category, the brand experienced a significant improvement in its ranking, moving from 44th position in January 2026 to breaking into the top 30 by April 2026. This upward trend is indicative of a strong market presence and could be attributed to strategic initiatives or product improvements. However, in the Flower category, Aura's ranking slipped from 39th position in January to 57th by April, which might suggest increased competition or shifting consumer preferences in the state.
Meanwhile, the Pre-Roll category demonstrated a similar decline, with Aura's ranking dropping from 44th in January to 71st by April. This downward trend could signal challenges in maintaining market share or the need for innovation in product offerings. On the other hand, the Vapor Pens category did not see Aura in the top 30 after January, indicating either a lack of focus or lower consumer demand for their products in this segment. These movements suggest a mixed performance for Aura / Aura Cannabis Company (MA) in Massachusetts, highlighting areas of both strength and potential improvement.
Competitive Landscape
In the competitive landscape of the Flower category in Massachusetts, Aura / Aura Cannabis Company (MA) has experienced notable fluctuations in its ranking, reflecting a dynamic market environment. Starting the year strong with a rank of 39 in January 2026, Aura saw an improvement in February, climbing to 34, before experiencing a decline in March and April, where it ranked 56 and 57, respectively. This downward trend in rank coincides with a decrease in sales during the same period. In contrast, competitors like Green Gold Group maintained a relatively stable position, only dropping to 55 in April after consistently ranking in the 40s, while Glorious Cannabis Co. showed resilience with a rank of 56 in April, despite fluctuations. Meanwhile, Theory Wellness experienced a significant rise in March, reaching a rank of 49, before dropping again in April. These shifts highlight the competitive pressure Aura faces, particularly from brands that have managed to stabilize or improve their standings, suggesting a need for strategic adjustments to regain and sustain higher market positioning.

Notable Products
In April 2026, the top-performing product from Aura / Aura Cannabis Company (MA) was Sunset Runtz Pre-Roll (1g) in the Pre-Roll category, which rose to the number one spot after being ranked fifth in March. This product achieved a notable sales figure of $1,949. Local Skunk Pre-Roll (1g) entered the rankings for the first time in April at the second position. MAC Stomper Pre-Roll (1g) maintained a consistent presence, ranking third in both February and April after being absent in March. Dead Head OG Pre-Roll (1g) experienced a decline, dropping from third place in March to fifth in April.
Top Selling Cannabis Brands
Data for this report comes from real-time sales reporting by participating cannabis retailers via their point-of-sale systems, which are linked up with Headset’s business intelligence software. Headset’s data is very reliable, as it comes digitally direct from our partner retailers. However, the potential does exist for misreporting in the instance of duplicates, incorrectly classified products, inaccurate entry of products into point-of-sale systems, or even simple human error at the point of purchase. Thus, there is a slight margin of error to consider. Brands listed on this page are ranked in the top twenty within the market and product category by total retail sales volume.

